Stardust-NExT NAVCAM Calibration and Performance
(9/01/11 preprint version)
Kenneth P. Klaasen,1* David Brown,1 Brian Carcich,2 Tony Farnham,3 William Owen,1 Peter
Thomas2
1
Jet Propulsion Laboratory, California Institute of Technology, Mail Stop 306-392, 4800 Oak
Grove Dr., Pasadena, CA 91109, USA
2
Cornell University, Space Sciences Building, Ithaca, NY 14853, USA
3
Department of Astronomy, University of Maryland, College Park, MD 20742-2421, USA
*to whom all correspondence should be addressed: email kenneth.p.klaasen@jpl.nasa.gov,
phone 818-354-4207, fax 818-393-3290
Abstract
NASA's Stardust-NExT mission used the Stardust spacecraft to deliver a scientific payload,
including a panchromatic visible camera designated NAVCAM, to a close flyby of comet
9P/Tempel 1 in February 2011. Proper interpretation of the NAVCAM images depends on
accurate calibration of the camera performance. While the NAVCAM had been calibrated
during the primary Stardust mission to comet 81P/Wild 2 in 2004, that calibration was
incomplete and somewhat lacking in fidelity. Substantial improvements in the NAVCAM
calibration were achieved during Stardust-NExT in the areas of geometric correction, spatial
resolution, and radiometric calibration (in particular, zero-exposure signal levels, shutter time
offsets, absolute radiometric response rate, noise characterization, and scattered light problems).
This improved calibration will allow upgrades to the calibration of images returned from the
Stardust primary mission as well as high-quality calibration of the Stardust-NExT images. The
upgraded calibration results have been incorporated into the Stardust-NExT image processing
pipeline via new routines and updated constants and files in preparation for archiving calibrated
images in the NASA Planetary Data System.
Keywords: Comet Tempel 1, instrumentation, data reduction techniques
Copyright 2011. All rights reserved.
1. Introduction
NASA's Stardust-NExT spacecraft carried a payload of three scientific instruments during its
extended mission to encounter comet 9P/Tempel 1 in February 2011 - a visible camera dubbed
NAVCAM, and two dust detection instruments. This spacecraft and instrument suite were also
used previously on the Stardust primary mission to comet 91P/Wild 2 in January 2004. The
NAVCAM was included in the Stardust payload primarily as a navigation tool to facilitate
optical navigation to the desired flyby points at asteroid Annefrank and comet Wild 2 and
autonomous tracking of the target bodies during the flybys. The NAVCAM's role as a scientific
imager was secondary. Therefore, while NAVCAM fulfilled its duties admirably during the
primary mission (Duxbury, et al., 2004; Tsou, et al., 2004; Brownlee, et al., 2004), and a set of
wonderful images of Wild 2 was transmitted to Earth, limited resources and effort were
expended during the Stardust mission on achieving high-precision characterization of the
NAVCAM performance for scientific calibration of those images (Newburn, 2000).
NASA approved a proposal to use the still healthy Stardust spacecraft to perform an extended
mission to Tempel 1 - called Stardust New Exploration of Tempel 1, or Stardust-NExT
(Veverka, et al., 2011a). For this new mission, the science priorities changed, and the
NAVCAM images became the highest priority science measurements. Therefore, it was
appropriate to expend substantial effort to improve and extend the inflight calibration of the
NAVCAM during Stardust-NExT. This paper documents the improvements, corrections, and
extensions of the NAVCAM calibration.
First we provide a brief description of the NAVCAM instrument and summarize the calibration
data collected during the Stardust-NExT mission. NAVCAM calibration results are then
discussed with emphasis on the differences from the previously reported calibrations. The
calibration is addressed in the areas of geometric measurement accuracy, spatial resolution
achieved, and radiometric measurement accuracy. Finally, the data calibration processing
pipeline is described along with the plans for data archiving in the NASA Planetary Data System
(PDS).
2. NAVCAM Description
The NAVCAM was constructed using a number of spare subassemblies left over from previous
flight projects. The optics are spare Voyager Wide-Angle Camera optics with a 200-mm focal
length operating at f/3.5. The detector is a spare Cassini 1024x1024-pixel CCD; coupled with
the optics, it provides a field of view (FOV) of about 3.5degree (60 microrad/pixel). We adopt a
convention in which pixel coordinate locations within the FOV are designated by line and
sample values; lines increment in the vertical direction, i.e., the direction of CCD parallel charge
transfer along columns, and samples increment in the CCD horizontal direction, i.e., the direction
of CCD serial register readout. NAVCAM includes spare Voyager shutter and filter-wheel
mechanisms. The filter wheel in the camera failed early in the primary mission, so all
subsequent images were acquired through the broadband optical-navigation spectral filter (475 -
925 nm). NAVCAM includes an internal calibration lamp that serves as a test source to check
camera aliveness, but the illumination on the detector is not uniform, so the cal lamp's utility as a
flat-field calibration source is limited. Image data can be returned either fully encoded to 12 bits
or compressed to 8 bits per pixel using an onboard lookup table. Images can be edited onboard
to return only one or more specified window areas from the frame. The spacecraft data system
can support a maximum imaging rate of one full frame every 6s for compressed data. The
camera boresight is pointed using a combination of spacecraft attitude and a one-axis scan mirror
that sweeps the boresight through 180degree in a half-plane centered in the direction opposite the solar
panel normal and containing the spacecraft dust shield direction (0degree mirror angle). At mirror
scan angles below 16degree, the view is through a periscope used to protect the optics from dust
damage during the comet flyby. Figure 1 shows a picture of the NAVCAM and its scan mirror.
A complete description of the NAVCAM is provided in Newburn, et al., (2003a).
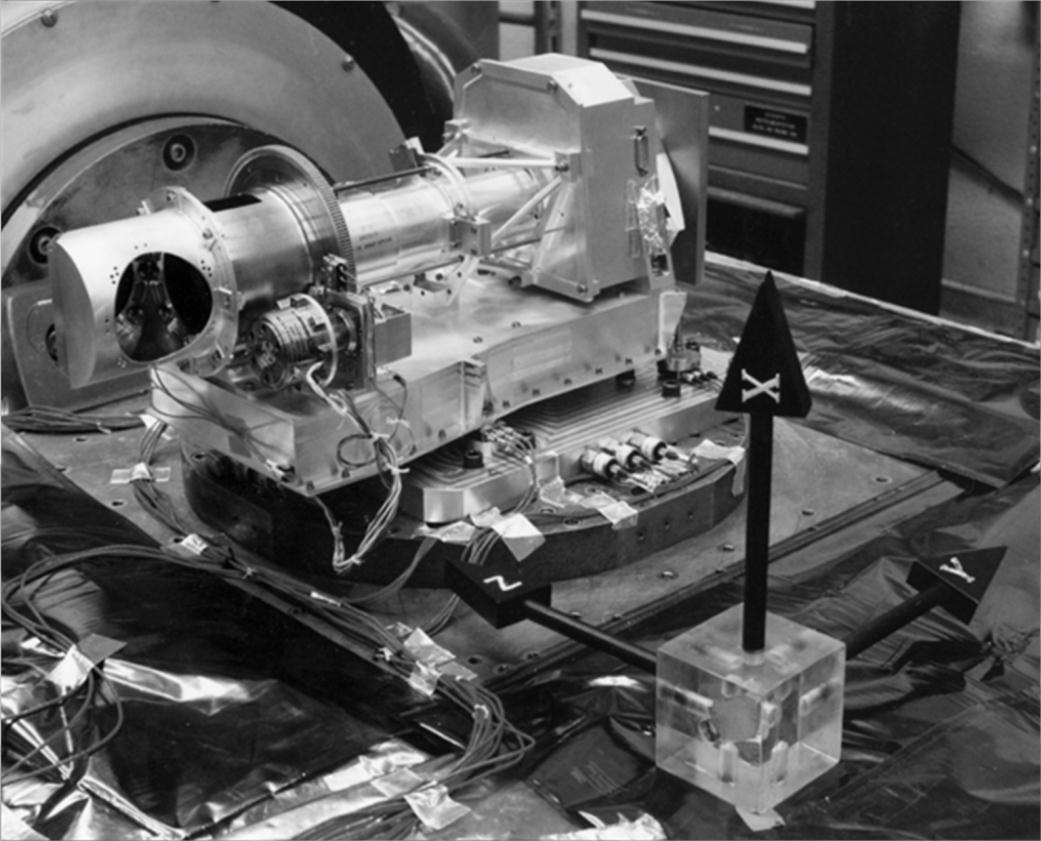 Figure 1 - The Stardust-NExT NAVCAM including its scan mirror mechanism on a laboratory
bench prior to launch
The NAVCAM suffers from a number of problems that ordinarily are not encountered in other
high-quality scientific spaceflight cameras (probably due to the lack of science priority on the
NAVCAM for the primary mission). First, early in the prime mission contamination was
observed to have accumulated within the NAVCAM that resulted in severe blurring of the
images (Hillier, et al., 2011; Newburn, et al., 2003a & b; Tsou, et al., 2004; Li, et al., 2009).
This contamination appears to get deposited on the CCD window (either inside the package or
outside) when the CCD is cold. Heating the CCD was found to remove the contamination
(mostly) and to allow good image quality, but eventually the contamination gets redeposited.
The contamination was successfully controlled by periodic heating of the instrument using its
internal electrical heaters and by placing direct sunlight on the camera radiator (called "bake"
maneuvers). Second, the CCD temperature is not controlled, and drifts in temperature cause
changes in the calibration. Third, no pre-exposure flush of accumulated CCD dark charge is
executed automatically; therefore, dark current builds up during the entire (variable) period
between successive CCD readouts. Fourth, the NAVCAM images exhibit horizontal bars of
coherent noise across most of the array whose source is unknown and that increase the
background noise from about 1 DN (data number) to 3 - 4 DN. And last, experience has shown
that scattered light rather easily enters the system, especially at high and low scan mirror angles.
3. Inflight Calibration Data
The performance of the NAVCAM was monitored throughout the Stardust-NExT extended
mission using a standard calibration sequence along with a few special calibrations. Calibrations
involved imaging of a variety of stars, several of which are photometric standards, acquiring dark
frames, and taking images illuminated by the NAVCAM internal calibration lamp. The cruise
calibrations allowed characterization of camera imaging performance in the areas of geometric
fidelity, spatial resolution, and radiometry (including zero-exposure signals, shutter times,
linearity, field flatness, noise, and radiometric response rate) more accurately than had been
possible during the primary mission. Preliminary radiometric calibration results have been
incorporated into the image processing pipeline. Special observations, including new analysis of
some of the Stardust prime mission data, allowed determination of the NAVCAM periscope
throughput as a function of scan mirror angle, scattered light levels from the spacecraft structure
as functions of mirror angle and the Sun illumination direction on the spacecraft, and charge
bleeding and residual image in the CCD detector. Calibration sequences similar to the standard
cruise calibration were also executed at Encounter (E) -18 days and at E+10 days. Table 1
summarizes the data taken during the Stardust-NExT mission that are useful for NAVCAM
calibration.
Selected data from the prime mission were also analyzed to broaden and deepen our
understanding of the NAVCAM performance in areas where the NExT data are not sufficient in
themselves. The prime mission data span a larger range of CCD temperatures, heater-off times,
power-on times, scan mirror angles, and S/C attitudes with respect to the Sun than did the NExT
mission alone. Almost all of the prime mission images are useful for camera calibration in one
way or another. Table 2 summarizes the NAVCAM performance aspects that were more fully
addressed using prime mission data and the general types of data used.
Date of
Acquisition Activity Data type Target Purpose Comments
0degree mirror
angle and cal Dark sky, cal Cal lamp image failed due
1/25/2007 Periscope test lamp images lamp Check camera and periscope health to command queue error
Star and cal Cal lamp image failed due
1/31/2007 Star imaging lamp images Star, cal lamp Check camera contamination level to command queue error
One of two cal lamp images
Pre-bake Star and cal Antares, cal Determine contamination state and failed due to command
10/12/2007 characterization lamp images lamp troubleshoot cal lamp problem queue problem
Star images
Post-bake and dark Camera clean, useful psf
10/25/2007 characterization frame Antares Verify removal of contamination data
Windowed
cal lamp Verify proper commanding of cal
1/25/2008 Cal lamp test frames Cal lamp lamp frames Successful
Star, dark,
Pre-bake and cal lamp
12/3/2008 characterization images Elnath Determine contamination state Camera contaminated
Star, dark,
Post-bake and cal lamp Camera clean, useful psf
12/15/2008 characterization images Dubhe Verify removal of contamination data
Star, dark, Canopus, bet Radiometry, psf, shutter offset,
and cal lamp Hyi, Achernar, scattered light at encounter
12/20/2008 Standard cruise cal images Vega, 16CygA attitude, flat field Good data set
Star, dark,
and cal lamp Verify camera remains clean for Camera clean, useful psf
12/31/2008 Contamination check images Procyon upcoming Moon imaging data
Determine image quality and
Moon and throughput of periscope vs. mirror
1/12/2009 Periscope test dark images Moon angle Good data set
Star, dark,
and cal lamp Verify camera remained clean for Camera clean, useful psf
1/12/2009 Contamination check images Beta Per prior Moon imaging data
Characterize elevated fixed-pattern Camera contaminated,
Star, dark, noise (FPN) with extended camera elevated FPN seen after 16
Pre-bake and cal lamp power on time and its dependence hr of power on in shuttered
8/6-8/2010 characterization images Regulus on contamination level frames only
Characterize elevated fixed-pattern Camera clean, elevated FPN
Star, dark, noise with extended camera seen after 16 h of power on
8/11- Post-bake and cal lamp power-on time and its dependence in shuttered frames only;
13/2010 characterization images Regulus on contamination level useful psf data
Unpointed portion of Cal lamp and
8/23/2010 standard cruise cal dark images Cal lamp Dark signal, shutter offset, flat field Good data set
Star, dark, Canopus, bet
Standard cruise cal and cal lamp Hyi, Achernar, Radiometry, psf, shutter offset,
1/27/2011 (pre-encounter) images Vega, 16CygA data compression Good data set
Star, dark, Canopus, bet
Standard cruise cal and cal lamp Hyi, Achernar, Radiometry, psf, shutter offset,
2/25/2011 (post-encounter) images Vega, 16CygA data compression, flat field Good data set
Table 1 - Summary of NAVCAM calibration data taken during the Stardust-NExT mission
NAVCAM performance
characteristic analyzed Stardust prime mission data used
Bias and dark current Zero-exposure full frames and full frames of stars
levels with mostly dark sky
Shutter polarity Early cruise frames (n0112-113), Moon images
determination (n0198-219), Annefrank images (n0371-476),
Wild 2 images (n2052-2113)
Periscope throughput Spica (n0247-49 & n0254-55), Pleiades (n0477-
507), Wild 2 (n2005-63)
Extended power-on Wild 2 approach (n0528-1023)
fixed pattern noise
Scattered light Opnav-filter star images (preferably full frames)
at a variety of mirror angles and S/C attitudes
including: n0165-308, selected Annefrank
images, n0477-529, selected windowed frames
from Wild 2 approach at different mirror angles,
n0634-48, n0869-76, most Wild 2 encounter
frames, n02125, n02127
Table 2 - NAVCAM calibration data from the Stardust prime mission that were used to extend
the characterization of camera performance
4. Geometric Calibration
Focal length and geometric distortion
The focal length and geometric distortion of the NAVCAM were determined using images of the
Pleiades star field. The usual technique is to relate the observed coordinate of each star image on
the detector (xp, yp in mm from the optical center derived from sample/line coordinates at 0.012
mm/pixel) to an "undistorted" position as
xp=(sample-ocx)/pixel
yp=(line-ocy)/pixel
R=sqrt(xp2+yp2)= radius from optical center
xc=xp * (1 + k*R2)
yc=yp * (1 + k*R2)
where ocx and ocy are the optical center coordinates in pixels,
pixel = 83.3333 pixel/mm,
xc, yc are the undistorted positions (mm), and k is the "distortion coefficient."
The differences between observed and predicted positions on the detector are the residuals, and
the solution is taken where the sum of squares of the residuals is minimized. The optical center
was only weakly defined, so it was assumed to be at (512.5, 512.5).
Stellar image positions are located by a centroiding algorithm, and their RA, Dec locations (Hog,
et al., 2000) and image locations in pixels are recorded. The Pleiades image contained 99 stars
bright enough to be accurately centroided. The solution of predicted versus actual positions on
the detector includes camera orientation, focal length (fl), and distortion (k). The solution gave a
focal length = 201.136 +/- 0.01 mm and k = 5.24x10⁻⁵ mm-2. These are small distortions.
Residuals were ~0.1 pixel.
Spatial resolution
The NAVCAM point-spread function (psf), defined as the fraction of the total point-source
signal captured in a given pixel as a function of the pixel's distance from the center of the psf,
was determined from star images having minimal smear and obtained with an uncontaminated
camera. The best psf solution to apply to the Tempel 1 encounter images is one based on the
images of Canopus taken during the pre- and post-encounter calibrations. These images exposed
Canopus to a peak signal of approximately one-half full scale, 10x that level, and 100x that level to
allow determination of the psf core along with the wings. These images yielded good quality psf
measurements out to about 15 pixels from the centroid. An image of Procyon taken in December
2008 with a peak signal of about 500x full scale was used to extend the psf determination out to
70 pixels from the centroid - a signal level of about 10-6 of the total star signal.
The data indicate that the psf is radially symmetric to within the accuracy of the measurements.
No measureable differences in the psf were observed during the NExT mission when the camera
was uncontaminated. Figure 2 shows the psf data along with piecewise functional fits to the
data; both semi-log and log-log plots are presented.
Figure 1 - The Stardust-NExT NAVCAM including its scan mirror mechanism on a laboratory
bench prior to launch
The NAVCAM suffers from a number of problems that ordinarily are not encountered in other
high-quality scientific spaceflight cameras (probably due to the lack of science priority on the
NAVCAM for the primary mission). First, early in the prime mission contamination was
observed to have accumulated within the NAVCAM that resulted in severe blurring of the
images (Hillier, et al., 2011; Newburn, et al., 2003a & b; Tsou, et al., 2004; Li, et al., 2009).
This contamination appears to get deposited on the CCD window (either inside the package or
outside) when the CCD is cold. Heating the CCD was found to remove the contamination
(mostly) and to allow good image quality, but eventually the contamination gets redeposited.
The contamination was successfully controlled by periodic heating of the instrument using its
internal electrical heaters and by placing direct sunlight on the camera radiator (called "bake"
maneuvers). Second, the CCD temperature is not controlled, and drifts in temperature cause
changes in the calibration. Third, no pre-exposure flush of accumulated CCD dark charge is
executed automatically; therefore, dark current builds up during the entire (variable) period
between successive CCD readouts. Fourth, the NAVCAM images exhibit horizontal bars of
coherent noise across most of the array whose source is unknown and that increase the
background noise from about 1 DN (data number) to 3 - 4 DN. And last, experience has shown
that scattered light rather easily enters the system, especially at high and low scan mirror angles.
3. Inflight Calibration Data
The performance of the NAVCAM was monitored throughout the Stardust-NExT extended
mission using a standard calibration sequence along with a few special calibrations. Calibrations
involved imaging of a variety of stars, several of which are photometric standards, acquiring dark
frames, and taking images illuminated by the NAVCAM internal calibration lamp. The cruise
calibrations allowed characterization of camera imaging performance in the areas of geometric
fidelity, spatial resolution, and radiometry (including zero-exposure signals, shutter times,
linearity, field flatness, noise, and radiometric response rate) more accurately than had been
possible during the primary mission. Preliminary radiometric calibration results have been
incorporated into the image processing pipeline. Special observations, including new analysis of
some of the Stardust prime mission data, allowed determination of the NAVCAM periscope
throughput as a function of scan mirror angle, scattered light levels from the spacecraft structure
as functions of mirror angle and the Sun illumination direction on the spacecraft, and charge
bleeding and residual image in the CCD detector. Calibration sequences similar to the standard
cruise calibration were also executed at Encounter (E) -18 days and at E+10 days. Table 1
summarizes the data taken during the Stardust-NExT mission that are useful for NAVCAM
calibration.
Selected data from the prime mission were also analyzed to broaden and deepen our
understanding of the NAVCAM performance in areas where the NExT data are not sufficient in
themselves. The prime mission data span a larger range of CCD temperatures, heater-off times,
power-on times, scan mirror angles, and S/C attitudes with respect to the Sun than did the NExT
mission alone. Almost all of the prime mission images are useful for camera calibration in one
way or another. Table 2 summarizes the NAVCAM performance aspects that were more fully
addressed using prime mission data and the general types of data used.
Date of
Acquisition Activity Data type Target Purpose Comments
0degree mirror
angle and cal Dark sky, cal Cal lamp image failed due
1/25/2007 Periscope test lamp images lamp Check camera and periscope health to command queue error
Star and cal Cal lamp image failed due
1/31/2007 Star imaging lamp images Star, cal lamp Check camera contamination level to command queue error
One of two cal lamp images
Pre-bake Star and cal Antares, cal Determine contamination state and failed due to command
10/12/2007 characterization lamp images lamp troubleshoot cal lamp problem queue problem
Star images
Post-bake and dark Camera clean, useful psf
10/25/2007 characterization frame Antares Verify removal of contamination data
Windowed
cal lamp Verify proper commanding of cal
1/25/2008 Cal lamp test frames Cal lamp lamp frames Successful
Star, dark,
Pre-bake and cal lamp
12/3/2008 characterization images Elnath Determine contamination state Camera contaminated
Star, dark,
Post-bake and cal lamp Camera clean, useful psf
12/15/2008 characterization images Dubhe Verify removal of contamination data
Star, dark, Canopus, bet Radiometry, psf, shutter offset,
and cal lamp Hyi, Achernar, scattered light at encounter
12/20/2008 Standard cruise cal images Vega, 16CygA attitude, flat field Good data set
Star, dark,
and cal lamp Verify camera remains clean for Camera clean, useful psf
12/31/2008 Contamination check images Procyon upcoming Moon imaging data
Determine image quality and
Moon and throughput of periscope vs. mirror
1/12/2009 Periscope test dark images Moon angle Good data set
Star, dark,
and cal lamp Verify camera remained clean for Camera clean, useful psf
1/12/2009 Contamination check images Beta Per prior Moon imaging data
Characterize elevated fixed-pattern Camera contaminated,
Star, dark, noise (FPN) with extended camera elevated FPN seen after 16
Pre-bake and cal lamp power on time and its dependence hr of power on in shuttered
8/6-8/2010 characterization images Regulus on contamination level frames only
Characterize elevated fixed-pattern Camera clean, elevated FPN
Star, dark, noise with extended camera seen after 16 h of power on
8/11- Post-bake and cal lamp power-on time and its dependence in shuttered frames only;
13/2010 characterization images Regulus on contamination level useful psf data
Unpointed portion of Cal lamp and
8/23/2010 standard cruise cal dark images Cal lamp Dark signal, shutter offset, flat field Good data set
Star, dark, Canopus, bet
Standard cruise cal and cal lamp Hyi, Achernar, Radiometry, psf, shutter offset,
1/27/2011 (pre-encounter) images Vega, 16CygA data compression Good data set
Star, dark, Canopus, bet
Standard cruise cal and cal lamp Hyi, Achernar, Radiometry, psf, shutter offset,
2/25/2011 (post-encounter) images Vega, 16CygA data compression, flat field Good data set
Table 1 - Summary of NAVCAM calibration data taken during the Stardust-NExT mission
NAVCAM performance
characteristic analyzed Stardust prime mission data used
Bias and dark current Zero-exposure full frames and full frames of stars
levels with mostly dark sky
Shutter polarity Early cruise frames (n0112-113), Moon images
determination (n0198-219), Annefrank images (n0371-476),
Wild 2 images (n2052-2113)
Periscope throughput Spica (n0247-49 & n0254-55), Pleiades (n0477-
507), Wild 2 (n2005-63)
Extended power-on Wild 2 approach (n0528-1023)
fixed pattern noise
Scattered light Opnav-filter star images (preferably full frames)
at a variety of mirror angles and S/C attitudes
including: n0165-308, selected Annefrank
images, n0477-529, selected windowed frames
from Wild 2 approach at different mirror angles,
n0634-48, n0869-76, most Wild 2 encounter
frames, n02125, n02127
Table 2 - NAVCAM calibration data from the Stardust prime mission that were used to extend
the characterization of camera performance
4. Geometric Calibration
Focal length and geometric distortion
The focal length and geometric distortion of the NAVCAM were determined using images of the
Pleiades star field. The usual technique is to relate the observed coordinate of each star image on
the detector (xp, yp in mm from the optical center derived from sample/line coordinates at 0.012
mm/pixel) to an "undistorted" position as
xp=(sample-ocx)/pixel
yp=(line-ocy)/pixel
R=sqrt(xp2+yp2)= radius from optical center
xc=xp * (1 + k*R2)
yc=yp * (1 + k*R2)
where ocx and ocy are the optical center coordinates in pixels,
pixel = 83.3333 pixel/mm,
xc, yc are the undistorted positions (mm), and k is the "distortion coefficient."
The differences between observed and predicted positions on the detector are the residuals, and
the solution is taken where the sum of squares of the residuals is minimized. The optical center
was only weakly defined, so it was assumed to be at (512.5, 512.5).
Stellar image positions are located by a centroiding algorithm, and their RA, Dec locations (Hog,
et al., 2000) and image locations in pixels are recorded. The Pleiades image contained 99 stars
bright enough to be accurately centroided. The solution of predicted versus actual positions on
the detector includes camera orientation, focal length (fl), and distortion (k). The solution gave a
focal length = 201.136 +/- 0.01 mm and k = 5.24x10⁻⁵ mm-2. These are small distortions.
Residuals were ~0.1 pixel.
Spatial resolution
The NAVCAM point-spread function (psf), defined as the fraction of the total point-source
signal captured in a given pixel as a function of the pixel's distance from the center of the psf,
was determined from star images having minimal smear and obtained with an uncontaminated
camera. The best psf solution to apply to the Tempel 1 encounter images is one based on the
images of Canopus taken during the pre- and post-encounter calibrations. These images exposed
Canopus to a peak signal of approximately one-half full scale, 10x that level, and 100x that level to
allow determination of the psf core along with the wings. These images yielded good quality psf
measurements out to about 15 pixels from the centroid. An image of Procyon taken in December
2008 with a peak signal of about 500x full scale was used to extend the psf determination out to
70 pixels from the centroid - a signal level of about 10-6 of the total star signal.
The data indicate that the psf is radially symmetric to within the accuracy of the measurements.
No measureable differences in the psf were observed during the NExT mission when the camera
was uncontaminated. Figure 2 shows the psf data along with piecewise functional fits to the
data; both semi-log and log-log plots are presented.
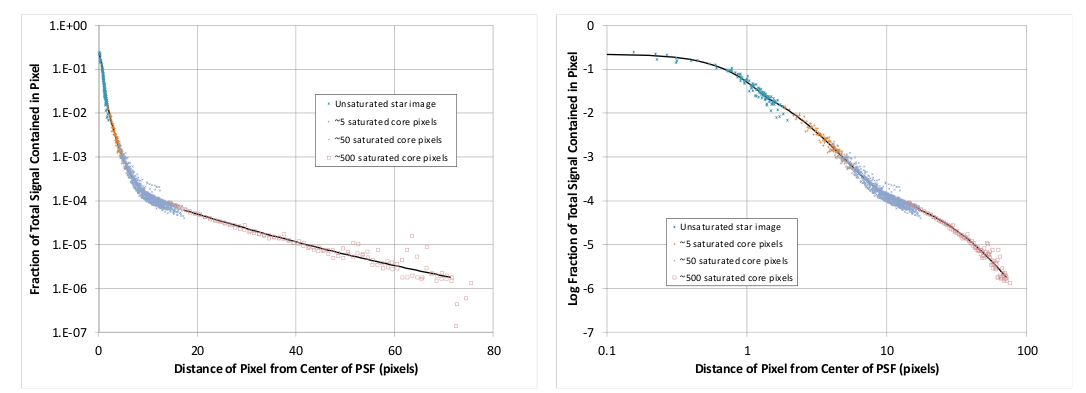 Figure 2 - NAVCAM psf vs. distance data and piecewise functional fits on linear and log scales
The psf piecewise functional fits are:
Distance from psf
centroid (pixels) psf function
-0.0193x^6 +0.184x^4 -0.7983x^2 - 0.6557
0 to 1.4046 psf = 10
3.06E-02x^2-0.5818x-0.9058
1.4046 to 5. 65 psf= 10
1.658E-05x^4-1.882E-03x^3+5.822E-02x^2-0.7402x-0.57
5. 65 to 17.307 psf= 10
1.1662E-04x^2 - 3.8699E-02x - 3.5758
17.307 to 75 psf= 10
These functions can be used as a spatial resolution enhancement filter if so desired for images
taken with the optical-navigation filter.
The fraction of total point source signal in the central pixel can range from 0.22 if the psf is
perfectly centered down to 0.07 if the centroid is located at the corner of a pixel. The psf full
width at half maximum (FWHM) is 1.29 pixels. No degradation in the psf has been observed
due to buildup of residual instrument contamination.
5. Radiometric Calibration
Response linearity and shutter time offsets
CCD detectors of the type used in NAVCAM are inherently linear in their response with respect
to incident photon flux. The linearity of the NAVCAM detector was confirmed by pre-launch
calibrations (Newburn, 2000). Response linearity was verified in flight using cal lamp images.
The NAVCAM response in sets of cal lamp images with increasing exposure times can be
modeled extremely well by a perfectly linear detector response coupled with fixed line-
dependent shutter time offsets (i.e., actual - commanded exposure times). Such models fit the
observed data to better than 0.1%.
The NAVCAM shutter blades move across image lines when making an exposure. The blades
move in alternating directions in successive frames (designated "forward" and "reverse"). The
blades always move in the "forward" direction after a NAVCAM power cycle. The shutter blade
movement polarity is not reset by a commanded dark frame.
The exposure time offsets are different for "forward" and "reverse" motion. On average,
exposures are ~0.4 ms longer than commanded for "forward" motion and ~1.4 ms shorter than
commanded for "reverse" motion. However, there is variation in the offset at each image line in
both cases. It was not possible to calibrate the shutter offset at each image line in flight due to
downlinked data volume limitations. Therefore, we refer back to shutter offset curves derived
from ground-based calibrations to estimate how the offsets vary with line number. Offset curves
were derived from integrating sphere flat-field images taken over a range of exposure times and
at different CCD temperatures. These curves are shown in Figure 3 along with the offsets
derived at three specific image lines from inflight cal lamp frames taken with short exposure
times (ranging from 0 to 35 ms). Note that the ground-based offsets taken at a CCD temperature
of -30degreeC have similar line dependence to the flight data (which makes sense, since that
temperature is closest to the -24degreeC temperature that applied when the flight data were taken).
Therefore, the inflight shutter offset line dependence was estimated by scaling the -30degreeC ground-
based offsets to fit the inflight results at three points using a quadratic scaling function.
Figure 2 - NAVCAM psf vs. distance data and piecewise functional fits on linear and log scales
The psf piecewise functional fits are:
Distance from psf
centroid (pixels) psf function
-0.0193x^6 +0.184x^4 -0.7983x^2 - 0.6557
0 to 1.4046 psf = 10
3.06E-02x^2-0.5818x-0.9058
1.4046 to 5. 65 psf= 10
1.658E-05x^4-1.882E-03x^3+5.822E-02x^2-0.7402x-0.57
5. 65 to 17.307 psf= 10
1.1662E-04x^2 - 3.8699E-02x - 3.5758
17.307 to 75 psf= 10
These functions can be used as a spatial resolution enhancement filter if so desired for images
taken with the optical-navigation filter.
The fraction of total point source signal in the central pixel can range from 0.22 if the psf is
perfectly centered down to 0.07 if the centroid is located at the corner of a pixel. The psf full
width at half maximum (FWHM) is 1.29 pixels. No degradation in the psf has been observed
due to buildup of residual instrument contamination.
5. Radiometric Calibration
Response linearity and shutter time offsets
CCD detectors of the type used in NAVCAM are inherently linear in their response with respect
to incident photon flux. The linearity of the NAVCAM detector was confirmed by pre-launch
calibrations (Newburn, 2000). Response linearity was verified in flight using cal lamp images.
The NAVCAM response in sets of cal lamp images with increasing exposure times can be
modeled extremely well by a perfectly linear detector response coupled with fixed line-
dependent shutter time offsets (i.e., actual - commanded exposure times). Such models fit the
observed data to better than 0.1%.
The NAVCAM shutter blades move across image lines when making an exposure. The blades
move in alternating directions in successive frames (designated "forward" and "reverse"). The
blades always move in the "forward" direction after a NAVCAM power cycle. The shutter blade
movement polarity is not reset by a commanded dark frame.
The exposure time offsets are different for "forward" and "reverse" motion. On average,
exposures are ~0.4 ms longer than commanded for "forward" motion and ~1.4 ms shorter than
commanded for "reverse" motion. However, there is variation in the offset at each image line in
both cases. It was not possible to calibrate the shutter offset at each image line in flight due to
downlinked data volume limitations. Therefore, we refer back to shutter offset curves derived
from ground-based calibrations to estimate how the offsets vary with line number. Offset curves
were derived from integrating sphere flat-field images taken over a range of exposure times and
at different CCD temperatures. These curves are shown in Figure 3 along with the offsets
derived at three specific image lines from inflight cal lamp frames taken with short exposure
times (ranging from 0 to 35 ms). Note that the ground-based offsets taken at a CCD temperature
of -30degreeC have similar line dependence to the flight data (which makes sense, since that
temperature is closest to the -24degreeC temperature that applied when the flight data were taken).
Therefore, the inflight shutter offset line dependence was estimated by scaling the -30degreeC ground-
based offsets to fit the inflight results at three points using a quadratic scaling function.
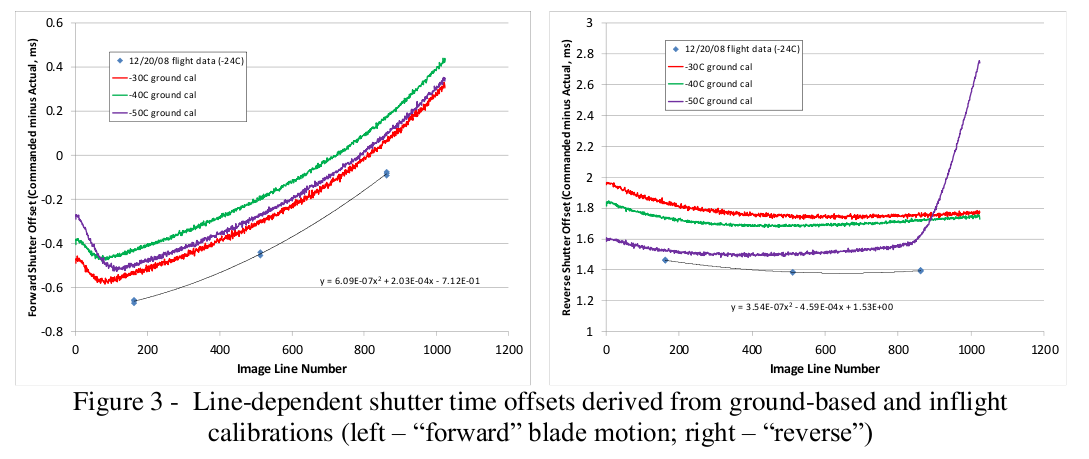 Figure 3 - Line-dependent shutter time offsets derived from ground-based and inflight
calibrations (left - "forward" blade motion; right - "reverse")
Shutter offset calibration data were taken four times during the NExT mission at four slightly
different CCD temperatures. The resulting data and the scaled line-dependent fits are shown in
Figure 4. The offsets derived from the August 2010 calibration were selected for application to
the Tempel 1 encounter data, since the CCD temperatures matched best. Note that to compute
the correct shutter polarity for any given frame, a supplemental command history file is required
to determine when all NAVCAM power off/on commands, all imaging commands for non-
returned frames, and all dark-frame image commands were issued, since this information is not
available in the raw image headers. The polarity information is then inserted into the calibrated
frame headers.
Figure 3 - Line-dependent shutter time offsets derived from ground-based and inflight
calibrations (left - "forward" blade motion; right - "reverse")
Shutter offset calibration data were taken four times during the NExT mission at four slightly
different CCD temperatures. The resulting data and the scaled line-dependent fits are shown in
Figure 4. The offsets derived from the August 2010 calibration were selected for application to
the Tempel 1 encounter data, since the CCD temperatures matched best. Note that to compute
the correct shutter polarity for any given frame, a supplemental command history file is required
to determine when all NAVCAM power off/on commands, all imaging commands for non-
returned frames, and all dark-frame image commands were issued, since this information is not
available in the raw image headers. The polarity information is then inserted into the calibrated
frame headers.
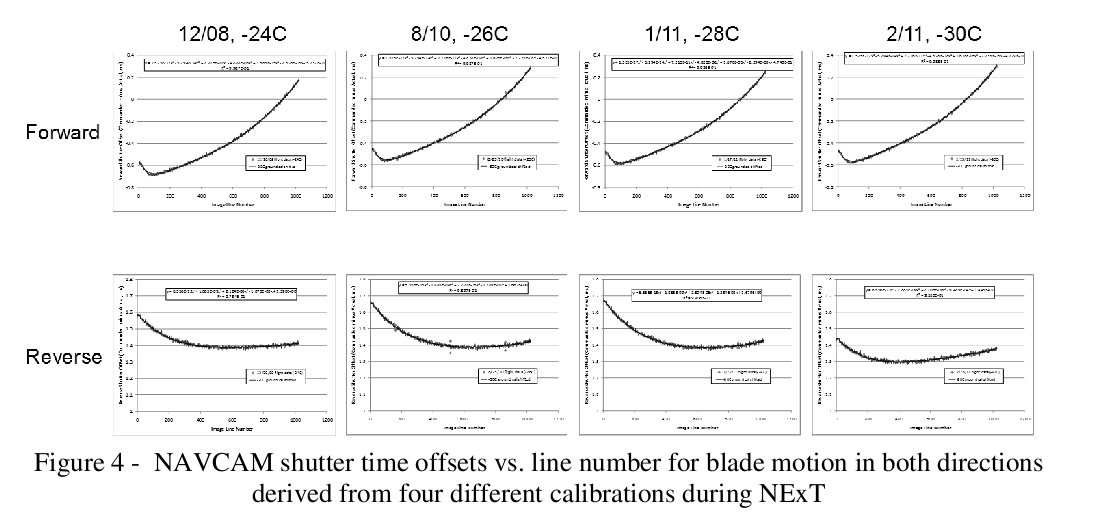 Figure 4 - NAVCAM shutter time offsets vs. line number for blade motion in both directions
derived from four different calibrations during NExT
Noise
NAVCAM data include four types of noise - detector read noise, photon shot noise, coherent
noise, and fixed-pattern noise. Read noise has been measured in differenced dark frame pairs to
be ~1.35 DN (1sigma, uncompressed). This level applies outside the horizontal coherent noise bars.
Within the coherent noise bars, the random noise level is increased to ~4.1 DN uncompressed
(this level of noise is barely detectable in compressed frames). The coherent noise bars are ~17
lines high and repeat every ~29 lines (~10 Hz cycle) and are shown in Figure 5. The mean DN
level within the bars is unchanged from that outside the bars. The cause of the coherent noise is
unknown. Attempts to remove the coherence leave residual random noise at the ~3.1 DN level.
No attempt to remove coherent noise was included in the image processing pipeline.
Figure 4 - NAVCAM shutter time offsets vs. line number for blade motion in both directions
derived from four different calibrations during NExT
Noise
NAVCAM data include four types of noise - detector read noise, photon shot noise, coherent
noise, and fixed-pattern noise. Read noise has been measured in differenced dark frame pairs to
be ~1.35 DN (1sigma, uncompressed). This level applies outside the horizontal coherent noise bars.
Within the coherent noise bars, the random noise level is increased to ~4.1 DN uncompressed
(this level of noise is barely detectable in compressed frames). The coherent noise bars are ~17
lines high and repeat every ~29 lines (~10 Hz cycle) and are shown in Figure 5. The mean DN
level within the bars is unchanged from that outside the bars. The cause of the coherent noise is
unknown. Attempts to remove the coherence leave residual random noise at the ~3.1 DN level.
No attempt to remove coherent noise was included in the image processing pipeline.
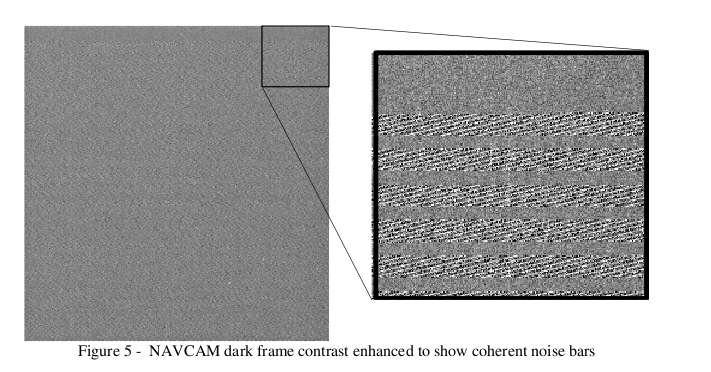 Figure 5 - NAVCAM dark frame contrast enhanced to show coherent noise bars
The NAVCAM detector exhibits fixed-pattern noise (FPN) in certain circumstances. This type
of noise was first observed on the approach to Wild 2 in the prime mission when the camera was
left powered on for an extended period in excess of two weeks (normally the camera had been
powered on only long enough to capture a small data set - usually a few minutes, perhaps up to 2
hours maximum). The Wild 2 approach data suggested that the FPN arises after the NAVCAM
has been powered on for >10 hr. The rise in FPN is accompanied by an associated rise in CCD
temperature. It occurs independent of the contamination level of the camera. But a peculiar
aspect of the FPN is that even after long power-on times with elevated CCD temperatures, the
FPN does not show up in dark frames, only in those that have had the shutter open to admit some
level of external photons (even if only a low-level scattered light background).
Further investigation of the FPN during NExT showed that the FPN level also depends on the
amount of background scattered light in an image. The Wild 2 approach images had scattered
light levels of <100 DN and raw FPN amplitudes of 6 - 20 DN rms. But during the NExT
approach to Tempel 1, much higher levels of scattered light were encountered, and the FPN
amplitude increased to 25 - 45 DN rms even when the camera had been powered on for only a
short time and the CCD temperature remained low.
These observations lead us to speculate that the FPN has two sources - hot pixels that generate
dark current at higher than typical rates, which are exaggerated by warm CCD temperatures, and
enhanced-response pixels that are more sensitive to incident photons than typical pixels. Oddly,
incident light appears to be needed to trigger both types of FPN pixels; even the hot pixels do not
produce excess charge unless the shutter is opened. In this FPN model, hot pixels dominate at
low scattered light levels (but require elevated CCD temperatures) while enhanced-response
pixels dominate at high scattered light levels. Figure 6 illustrates the FPN dependence on
scattered light level and camera power-on time. Since FPN was not seen in any pre-launch
integrating sphere images, we expect that both types of FPN pixels are a result of radiation
damage to the CCD accumulating in flight.
Figure 5 - NAVCAM dark frame contrast enhanced to show coherent noise bars
The NAVCAM detector exhibits fixed-pattern noise (FPN) in certain circumstances. This type
of noise was first observed on the approach to Wild 2 in the prime mission when the camera was
left powered on for an extended period in excess of two weeks (normally the camera had been
powered on only long enough to capture a small data set - usually a few minutes, perhaps up to 2
hours maximum). The Wild 2 approach data suggested that the FPN arises after the NAVCAM
has been powered on for >10 hr. The rise in FPN is accompanied by an associated rise in CCD
temperature. It occurs independent of the contamination level of the camera. But a peculiar
aspect of the FPN is that even after long power-on times with elevated CCD temperatures, the
FPN does not show up in dark frames, only in those that have had the shutter open to admit some
level of external photons (even if only a low-level scattered light background).
Further investigation of the FPN during NExT showed that the FPN level also depends on the
amount of background scattered light in an image. The Wild 2 approach images had scattered
light levels of <100 DN and raw FPN amplitudes of 6 - 20 DN rms. But during the NExT
approach to Tempel 1, much higher levels of scattered light were encountered, and the FPN
amplitude increased to 25 - 45 DN rms even when the camera had been powered on for only a
short time and the CCD temperature remained low.
These observations lead us to speculate that the FPN has two sources - hot pixels that generate
dark current at higher than typical rates, which are exaggerated by warm CCD temperatures, and
enhanced-response pixels that are more sensitive to incident photons than typical pixels. Oddly,
incident light appears to be needed to trigger both types of FPN pixels; even the hot pixels do not
produce excess charge unless the shutter is opened. In this FPN model, hot pixels dominate at
low scattered light levels (but require elevated CCD temperatures) while enhanced-response
pixels dominate at high scattered light levels. Figure 6 illustrates the FPN dependence on
scattered light level and camera power-on time. Since FPN was not seen in any pre-launch
integrating sphere images, we expect that both types of FPN pixels are a result of radiation
damage to the CCD accumulating in flight.
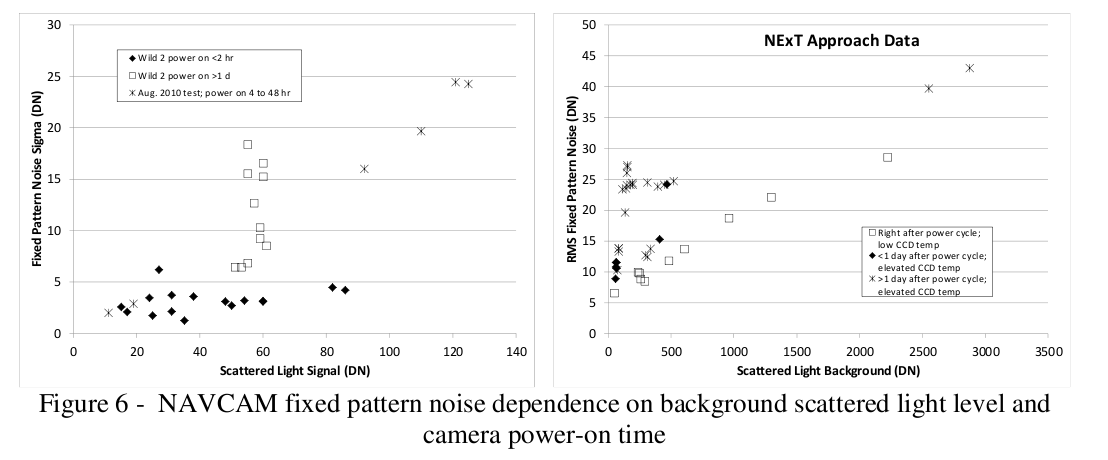 Figure 6 - NAVCAM fixed pattern noise dependence on background scattered light level and
camera power-on time
The hypothesis that some of the FPN source pixels are hot pixels that generate excessive dark
current was investigated by looking at the behavior of a few individual pixels. Their signal
generation rates were calculated over a range of CCD temperatures. As shown in Figure 7, the
dependence of the signal generation rates of these pixels on CCD temperature is very typical of
that of thermal dark current. However, the signal levels in these pixels at a given CCD
temperature are proportional to image integration time (i.e., the length of time the shutter is
open), not to the time between CCD reads. This observation provides more evidence that these
hot pixels need incident light to trigger them. We do not understand the device physics that
requires incident photons to produce enhanced thermal dark current rates in selected pixels, but
that seems to be what is happening.
Figure 6 - NAVCAM fixed pattern noise dependence on background scattered light level and
camera power-on time
The hypothesis that some of the FPN source pixels are hot pixels that generate excessive dark
current was investigated by looking at the behavior of a few individual pixels. Their signal
generation rates were calculated over a range of CCD temperatures. As shown in Figure 7, the
dependence of the signal generation rates of these pixels on CCD temperature is very typical of
that of thermal dark current. However, the signal levels in these pixels at a given CCD
temperature are proportional to image integration time (i.e., the length of time the shutter is
open), not to the time between CCD reads. This observation provides more evidence that these
hot pixels need incident light to trigger them. We do not understand the device physics that
requires incident photons to produce enhanced thermal dark current rates in selected pixels, but
that seems to be what is happening.
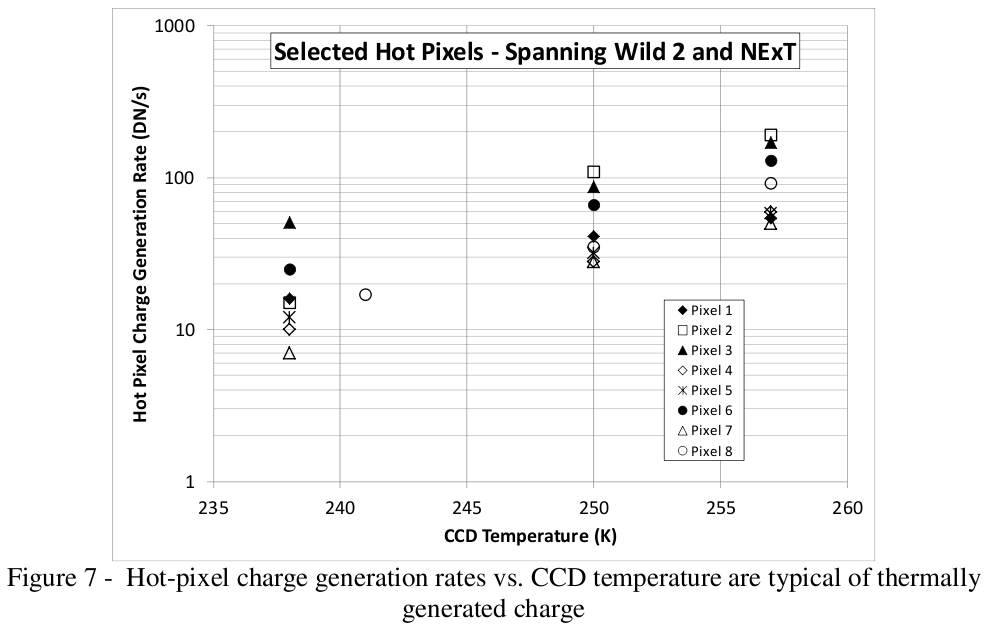 Figure 7 - Hot-pixel charge generation rates vs. CCD temperature are typical of thermally
generated charge
The FPN can be largely eliminated by successive frame differencing when identical frame pairs
are acquired. No evidence of FPN is found in the Tempel 1 close encounter images, which were
acquired using data compression, at short power-on time, and with minimal scattered light. No
attempts to correct for FPN are included in the NAVCAM processing pipeline.
Gain and full well
Photon shot noise allows a determination of the NAVCAM system gain constant (e-/DN) using
the photon transfer technique (i.e., plotting random noise vs. signal from differenced cal lamp
images and dark frames; Janesick, et al., 1987). Figure 8 gives an example photon transfer curve
illustrating the derivation of gain and read noise. The read noise represents an average across the
frame including both coherent noise areas and areas free of coherent noise. The gain constant
has gradually increased during the NExT mission from about 25 e-/DN in December 2008 to
about 27.5 e-/DN in February 2011. However, the gain constant is not used explicitly in
radiometric calibration; it is subsumed in the absolute radiometric conversion factor (converting
from DN to scene radiance). Note that ADC saturation (4095 DN) is reached before CCD full
well.
Figure 7 - Hot-pixel charge generation rates vs. CCD temperature are typical of thermally
generated charge
The FPN can be largely eliminated by successive frame differencing when identical frame pairs
are acquired. No evidence of FPN is found in the Tempel 1 close encounter images, which were
acquired using data compression, at short power-on time, and with minimal scattered light. No
attempts to correct for FPN are included in the NAVCAM processing pipeline.
Gain and full well
Photon shot noise allows a determination of the NAVCAM system gain constant (e-/DN) using
the photon transfer technique (i.e., plotting random noise vs. signal from differenced cal lamp
images and dark frames; Janesick, et al., 1987). Figure 8 gives an example photon transfer curve
illustrating the derivation of gain and read noise. The read noise represents an average across the
frame including both coherent noise areas and areas free of coherent noise. The gain constant
has gradually increased during the NExT mission from about 25 e-/DN in December 2008 to
about 27.5 e-/DN in February 2011. However, the gain constant is not used explicitly in
radiometric calibration; it is subsumed in the absolute radiometric conversion factor (converting
from DN to scene radiance). Note that ADC saturation (4095 DN) is reached before CCD full
well.
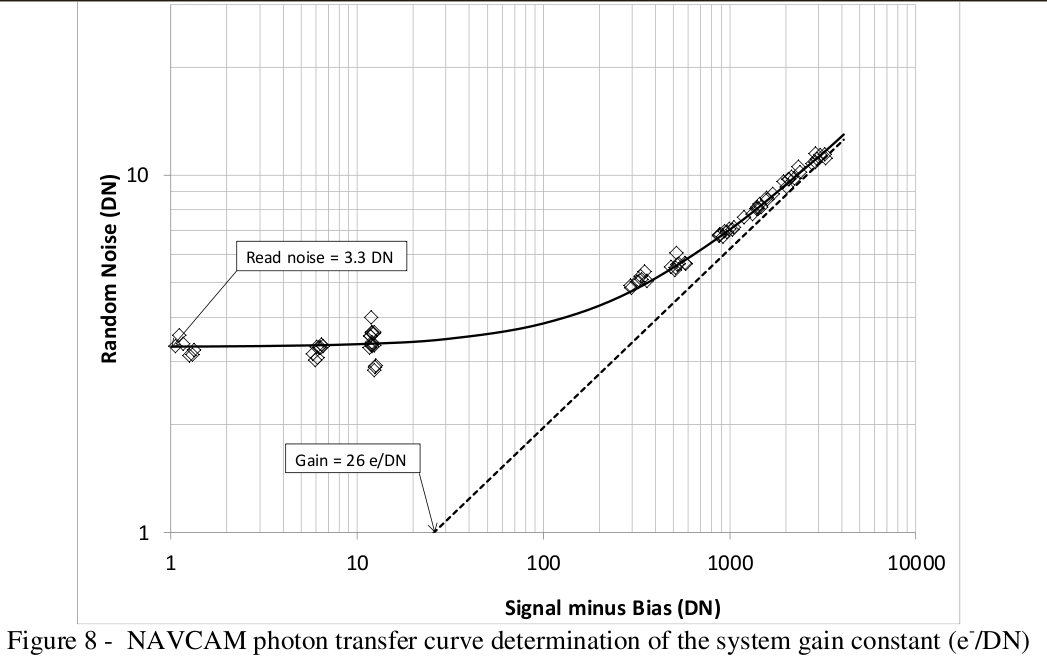 Figure 8 - NAVCAM photon transfer curve determination of the system gain constant (e-/DN)
Zero-exposure signal level
Knowledge of the zero-exposure bias level and dark current buildup are essential to proper
radiometric image calibration. The bias level can be determined from the serial overclocked
pixels (Newburn, et al., 2003a). However, the serial overclocked pixels do not all accurately
reflect the bias level within the active area of the detector array. Figure 9 shows the difference
between the mean DN value in the active area of a dark frame and the leading and trailing
overclocked pixel values. The overclocked pixel values from columns 1044 - 1046 are the
closest to the mean value in the active array; therefore, we use these columns to derive the bias
level in the calibration pipeline.
Figure 8 - NAVCAM photon transfer curve determination of the system gain constant (e-/DN)
Zero-exposure signal level
Knowledge of the zero-exposure bias level and dark current buildup are essential to proper
radiometric image calibration. The bias level can be determined from the serial overclocked
pixels (Newburn, et al., 2003a). However, the serial overclocked pixels do not all accurately
reflect the bias level within the active area of the detector array. Figure 9 shows the difference
between the mean DN value in the active area of a dark frame and the leading and trailing
overclocked pixel values. The overclocked pixel values from columns 1044 - 1046 are the
closest to the mean value in the active array; therefore, we use these columns to derive the bias
level in the calibration pipeline.
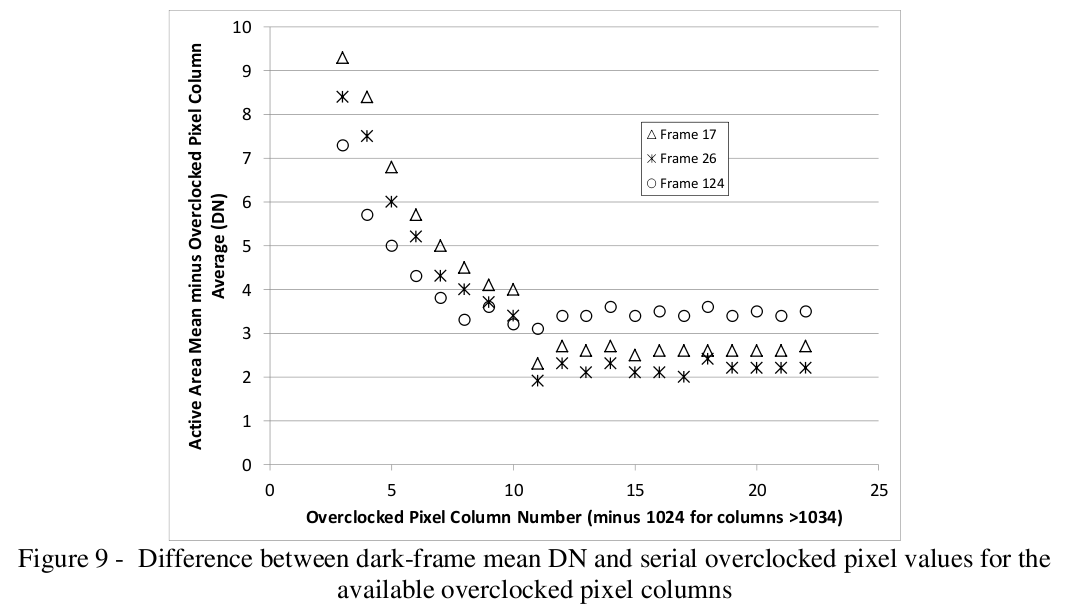 Figure 9 - Difference between dark-frame mean DN and serial overclocked pixel values for the
available overclocked pixel columns
However, no overclocked pixels are returned for windowed images, and a large number of
windowed images were taken during NExT. So another approach is required to estimate the
correct bias for windowed frames. Analysis of the overclocked pixel bias levels from frames
acquired at a variety of CCD temperatures during both Stardust and NExT shows that the bias
varies with CCD temperature at a rate of ~3.5 DN decrease for every 1degreeC increase in CCD
temperature. But other factors also affect the bias. The bias level seems to be correlated with the
time since the CCD heater was last on (which may be a proxy for the level of contamination, but
why the contamination level should affect the bias is unknown). No other correlations have been
found. Figure 10 illustrates the dependence of the bias level on time since the CCD heater was
turned off and on the CCD temperature. We model the bias dependence on heater-off time by
Bias (DN at CCD temp of 240.795degreeC) = 20.435 ln (heater-off time in days if between 0.1
and 100 days, else 0.1 or 100 days) + 427.53
and then adjust for differing CCD temperature using the -3.5 DN/degree factor. The residual
uncertainty in estimating the true bias remains quite large when this approach must be used - ~30
DN for heater-off times <2 days and ~50 DN for longer heater-off times. This uncertainty is
reflected in the Uncertainty Map image extension for calibrated frames produced by the pipeline
(see Section 6).
Figure 9 - Difference between dark-frame mean DN and serial overclocked pixel values for the
available overclocked pixel columns
However, no overclocked pixels are returned for windowed images, and a large number of
windowed images were taken during NExT. So another approach is required to estimate the
correct bias for windowed frames. Analysis of the overclocked pixel bias levels from frames
acquired at a variety of CCD temperatures during both Stardust and NExT shows that the bias
varies with CCD temperature at a rate of ~3.5 DN decrease for every 1degreeC increase in CCD
temperature. But other factors also affect the bias. The bias level seems to be correlated with the
time since the CCD heater was last on (which may be a proxy for the level of contamination, but
why the contamination level should affect the bias is unknown). No other correlations have been
found. Figure 10 illustrates the dependence of the bias level on time since the CCD heater was
turned off and on the CCD temperature. We model the bias dependence on heater-off time by
Bias (DN at CCD temp of 240.795degreeC) = 20.435 ln (heater-off time in days if between 0.1
and 100 days, else 0.1 or 100 days) + 427.53
and then adjust for differing CCD temperature using the -3.5 DN/degree factor. The residual
uncertainty in estimating the true bias remains quite large when this approach must be used - ~30
DN for heater-off times <2 days and ~50 DN for longer heater-off times. This uncertainty is
reflected in the Uncertainty Map image extension for calibrated frames produced by the pipeline
(see Section 6).
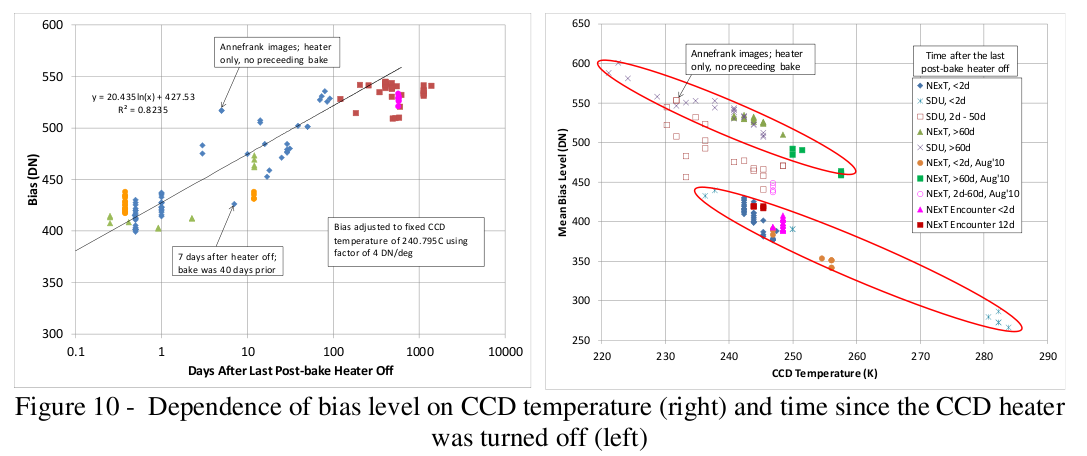 Figure 10 - Dependence of bias level on CCD temperature (right) and time since the CCD heater
was turned off (left)
In addition to the bias level, dark current must also be subtracted off as part of proper radiometric
calibration. As mentioned in Section 2, NAVCAM does not flush the CCD prior to every
integration period; all CCD flushes must be explicitly commanded. Therefore, the dark current
builds up from the time of the last CCD readout, which can be 10s to 100s of seconds. So to
properly calculate the level of dark current in a frame, both the dark current rate (which is a
function of CCD temperature) and the buildup time must be known. In determining the
NAVCAM dark current generation rate for a zero-exposure frame, we assume that the signal
difference between the active array signal and the bias level in columns 1044-1046 represents
dark current signal. Figure 11 shows the measured dark current rates vs. CCD temperature for a
variety of frames collected during the prime mission and NExT. The dark current rate is ~0.1
DN/s at typical CCD temperatures. In the pipeline, we use the ground-based calibration rate
curve for data acquired prior to 2010 and the inflight rate curve from NExT for data acquired in
2010 and beyond. Note that for both estimated windowed bias and dark current level
calculations, supplemental command history files are required to determine CCD heater-off time
and the time between CCD frame flushes, since this information is not available in the raw image
headers. The information is, however, inserted into the calibrated frame headers.
Figure 10 - Dependence of bias level on CCD temperature (right) and time since the CCD heater
was turned off (left)
In addition to the bias level, dark current must also be subtracted off as part of proper radiometric
calibration. As mentioned in Section 2, NAVCAM does not flush the CCD prior to every
integration period; all CCD flushes must be explicitly commanded. Therefore, the dark current
builds up from the time of the last CCD readout, which can be 10s to 100s of seconds. So to
properly calculate the level of dark current in a frame, both the dark current rate (which is a
function of CCD temperature) and the buildup time must be known. In determining the
NAVCAM dark current generation rate for a zero-exposure frame, we assume that the signal
difference between the active array signal and the bias level in columns 1044-1046 represents
dark current signal. Figure 11 shows the measured dark current rates vs. CCD temperature for a
variety of frames collected during the prime mission and NExT. The dark current rate is ~0.1
DN/s at typical CCD temperatures. In the pipeline, we use the ground-based calibration rate
curve for data acquired prior to 2010 and the inflight rate curve from NExT for data acquired in
2010 and beyond. Note that for both estimated windowed bias and dark current level
calculations, supplemental command history files are required to determine CCD heater-off time
and the time between CCD frame flushes, since this information is not available in the raw image
headers. The information is, however, inserted into the calibrated frame headers.
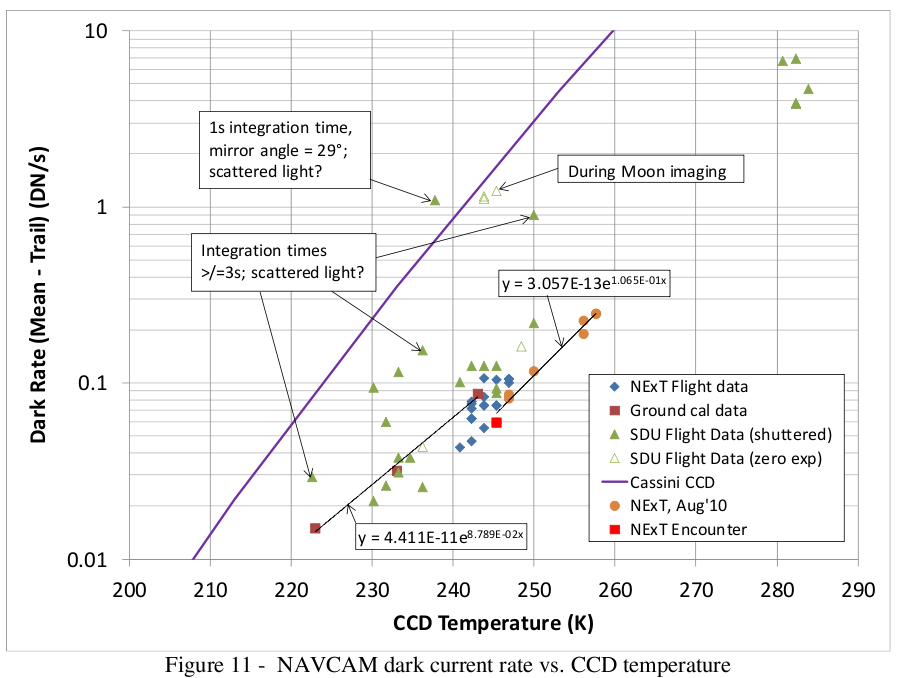 Figure 11 - NAVCAM dark current rate vs. CCD temperature
Absolute radiometric response rate
The absolute radiometric response rate of the NAVCAM (i.e., DN/s for a given scene radiance)
was determined from its response while imaging several photometric standard stars (Canopus,
bet Hyi, Achernar, Vega, and 16CygA & B; Morel and Magnenat, 1978; Pickles, 1998;
Burnashev, 1985). The theoretical basis for this type of calibration is discussed in Klaasen, et
al., 2008. We measured the total star signals vs. exposure times, including best-fit shutter
offsets. The primary errors in the measurements are due to uncertainties in the correct
background level to subtract because: a) most data used windowed frames for which
overclocked bias values are not available; b) bias drifts with CCD temperature, the CCD
temperature increases with camera operating time, and the telemetered CCD temperature is only
quantized in 1.53degreeC steps; c) many frames contain scattered light spatial gradients across the
array; and d) the inherent background noise (~3.4 DN, 1sigma) leaves residual errors in computing its
mean value.
Aperture photometry was performed on the stars imaged in December 2008 using 17x17 and
51x51-pixel box sizes. The background level was determined from the boundary pixels between
48x48 and 51x51-pixel boxes. The NAVCAM model psf was used to determine the fraction of
the total star signal we would expect to capture in each box size, and the measured signal was
scaled up by dividing by this fraction to get the best estimate of the total star signal. Based on
these measurements, the NAVCAM spectral response math model was adjusted so that the total
star signals predicted by the model best matched those measured. Based on the results of the
December 2008 calibration, and using the inflight derived gain factor of 25 e-/DN, we found that
the measured star signals averaged about 0.93 of the levels predicted by the math model using
pre-launch component calibration data. The model CCD quantum efficiency was reduced by this
factor to improve the model fits. Figure 12 plots the updated NAVCAM response rate vs.
wavelength when observing a flat diffuse reflector of 100% reflectivity at all wavelengths
illuminated by the Sun from a distance of 1 AU This updated NAVCAM spectral response
model was used to compute the following radiometric calibration factors to scene reflectance
(I/F, where I=scene radiance and F=solar irradiance/PI) and radiance:
3.89 x 10⁻⁵ (I/F units)/(DN/ms) for a solar-illuminated surface at 1 AU
1.93 x 10⁻⁹ (W/cm2/nm/sr)/(DN/ms) for a spectrally flat source radiance.
The system effective wavelength determined this way is 647 nm for I/F measurements (solar
spectrum; see http://rredc.nrel.gov/solar/spectra/am0/ for ASTM E490 solar spectrum) and 666
nm for radiance measurements (flat spectrum). Residual scatter of about 10% remains in the
actual vs. modeled star signals. This level of uncertainty is what can be expected from the
measurement of total signal from a single well-exposed star image. No systematic variations in
response rate were observed with position in the FOV.
Figure 11 - NAVCAM dark current rate vs. CCD temperature
Absolute radiometric response rate
The absolute radiometric response rate of the NAVCAM (i.e., DN/s for a given scene radiance)
was determined from its response while imaging several photometric standard stars (Canopus,
bet Hyi, Achernar, Vega, and 16CygA & B; Morel and Magnenat, 1978; Pickles, 1998;
Burnashev, 1985). The theoretical basis for this type of calibration is discussed in Klaasen, et
al., 2008. We measured the total star signals vs. exposure times, including best-fit shutter
offsets. The primary errors in the measurements are due to uncertainties in the correct
background level to subtract because: a) most data used windowed frames for which
overclocked bias values are not available; b) bias drifts with CCD temperature, the CCD
temperature increases with camera operating time, and the telemetered CCD temperature is only
quantized in 1.53degreeC steps; c) many frames contain scattered light spatial gradients across the
array; and d) the inherent background noise (~3.4 DN, 1sigma) leaves residual errors in computing its
mean value.
Aperture photometry was performed on the stars imaged in December 2008 using 17x17 and
51x51-pixel box sizes. The background level was determined from the boundary pixels between
48x48 and 51x51-pixel boxes. The NAVCAM model psf was used to determine the fraction of
the total star signal we would expect to capture in each box size, and the measured signal was
scaled up by dividing by this fraction to get the best estimate of the total star signal. Based on
these measurements, the NAVCAM spectral response math model was adjusted so that the total
star signals predicted by the model best matched those measured. Based on the results of the
December 2008 calibration, and using the inflight derived gain factor of 25 e-/DN, we found that
the measured star signals averaged about 0.93 of the levels predicted by the math model using
pre-launch component calibration data. The model CCD quantum efficiency was reduced by this
factor to improve the model fits. Figure 12 plots the updated NAVCAM response rate vs.
wavelength when observing a flat diffuse reflector of 100% reflectivity at all wavelengths
illuminated by the Sun from a distance of 1 AU This updated NAVCAM spectral response
model was used to compute the following radiometric calibration factors to scene reflectance
(I/F, where I=scene radiance and F=solar irradiance/PI) and radiance:
3.89 x 10⁻⁵ (I/F units)/(DN/ms) for a solar-illuminated surface at 1 AU
1.93 x 10⁻⁹ (W/cm2/nm/sr)/(DN/ms) for a spectrally flat source radiance.
The system effective wavelength determined this way is 647 nm for I/F measurements (solar
spectrum; see http://rredc.nrel.gov/solar/spectra/am0/ for ASTM E490 solar spectrum) and 666
nm for radiance measurements (flat spectrum). Residual scatter of about 10% remains in the
actual vs. modeled star signals. This level of uncertainty is what can be expected from the
measurement of total signal from a single well-exposed star image. No systematic variations in
response rate were observed with position in the FOV.
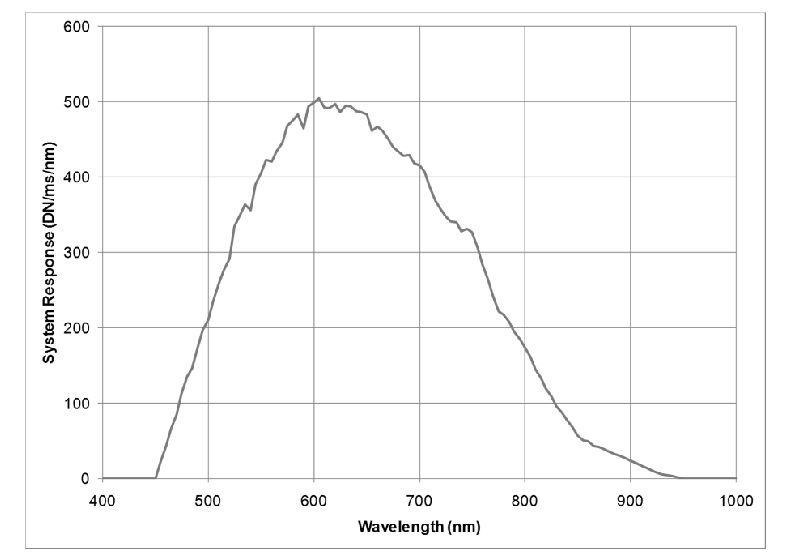 Figure 12 - Modeled NAVCAM spectral response rate to a solar-illuminated surface with I/F=1
at 1 AU based on December 2008 inflight calibration
A similar analysis was done using the star images from the pre- and post-encounter calibrations
in 2011. These data exhibited a larger amount of scatter - about 20% after excluding outliers
due to low SNR and high scattered light. Contrary to the 2008 results, the 2011 calibrations
showed an apparent correlation between signal rate and location of the star in the camera FOV.
Lower signal rates were seen for stars imaged near the center of the frame, as illustrated in
Figure 13 (left). One possible cause for this change could be residual contamination that is no
longer being removed by the bake process. We elected to do a normalization of the data to scale
all the measurements to their equivalent value if they had been made at the center of the FOV.
Figure 13 (right) shows the best-fit derived normalization function. Applying this normalization
reduced the scatter to ~5% for a given aperture box size on a given day.
Figure 12 - Modeled NAVCAM spectral response rate to a solar-illuminated surface with I/F=1
at 1 AU based on December 2008 inflight calibration
A similar analysis was done using the star images from the pre- and post-encounter calibrations
in 2011. These data exhibited a larger amount of scatter - about 20% after excluding outliers
due to low SNR and high scattered light. Contrary to the 2008 results, the 2011 calibrations
showed an apparent correlation between signal rate and location of the star in the camera FOV.
Lower signal rates were seen for stars imaged near the center of the frame, as illustrated in
Figure 13 (left). One possible cause for this change could be residual contamination that is no
longer being removed by the bake process. We elected to do a normalization of the data to scale
all the measurements to their equivalent value if they had been made at the center of the FOV.
Figure 13 (right) shows the best-fit derived normalization function. Applying this normalization
reduced the scatter to ~5% for a given aperture box size on a given day.
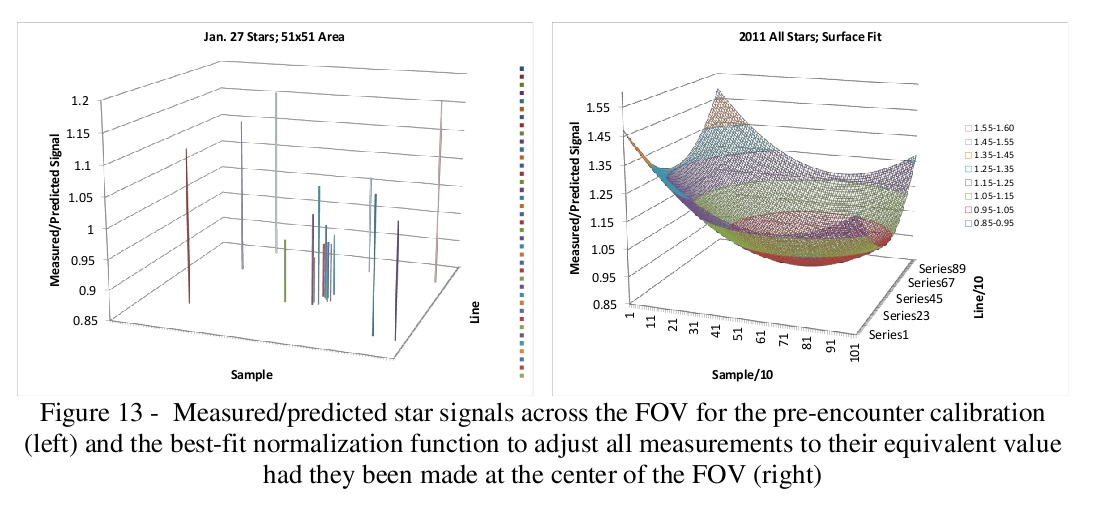 Figure 13 - Measured/predicted star signals across the FOV for the pre-encounter calibration
(left) and the best-fit normalization function to adjust all measurements to their equivalent value
had they been made at the center of the FOV (right)
Using the average normalized star signals for the two photometry box sizes, the final ratios of the
measured star signals to those predicted using the 2008 NAVCAM response model were 0.99 for
the pre-encounter calibration and 0.935 for the post-encounter calibration. For calibration of the
encounter data beginning on 2/14/11, we choose to adjust the calibration constants in the pipeline
by the average of these two values yielding:
4.05 x 10⁻⁵ (I/F units)/(DN/ms) for a solar-illuminated surface at 1 AU
2.01 x 10⁻⁹ (W/cm2/nm/sr)/(DN/ms) for a spectrally flat source radiance.
These constants really apply only at the center of the FOV; they may slightly overestimate the
scene reflectance or radiance at FOV locations away from the center.
The calibration constants derived above do not include the effects of viewing through the
periscope. NAVCAM views entirely or partially through the periscope for scan mirror angles
between 0degree and 16degree. The periscope reduces the light throughput to the NAVCAM, and it
produces double images when viewing partially through the periscope (>7degree mirror angle). The
optical throughput of the periscope was characterized using Stardust images of the Pleiades and
Spica and NExT images of the Moon. Figure 14 shows the relative throughput of the periscope
vs. scan mirror angle for these images; note that the throughput is slightly different as a function
of image line number for a given mirror angle. Images at lower line numbers have their
throughput profiles shifted toward higher mirror angles relative to those of images at higher line
numbers. The images of Star 1 were located at line numbers ranging between 423 and 526, those
for Star 2 ranged between 529 and 638, those for Star 3 ranged between 622 and 749, those for
Star 4 ranged between 614 and 715, those for Star 5 ranged between 657 and 790, and those for
star 6 ranged between 699 and 812. No throughput dependence on the image sample location
was observed over the range of sample numbers from 292 to 598. The Stardust Moon images
were located at line numbers ranging between 396 and 488; thus, the fact that the throughput
ratios for the Moon fall closest to those of Pleiades Star 1 is consistent with their similar line
locations.
The throughput vs. mirror angle plot suggests that as the mirror angle moves away from 0degree some
additional light starts to be lost when the angle reaches about 5degree. Perhaps the periscope no
longer fills the scan mirror entrance aperture at this angle. The amount of light lost continues to
increase up to a mirror angle of about 9degree. Beyond that angle some light that bypasses the
periscope starts to be captured by the scan mirror causing the "throughput" to increase. The
"throughput" continues to increase with mirror angle as more and more bypass light is captured,
until the periscope is no longer in the scan mirror FOV at all at an angle of about 16degree.
Figure 13 - Measured/predicted star signals across the FOV for the pre-encounter calibration
(left) and the best-fit normalization function to adjust all measurements to their equivalent value
had they been made at the center of the FOV (right)
Using the average normalized star signals for the two photometry box sizes, the final ratios of the
measured star signals to those predicted using the 2008 NAVCAM response model were 0.99 for
the pre-encounter calibration and 0.935 for the post-encounter calibration. For calibration of the
encounter data beginning on 2/14/11, we choose to adjust the calibration constants in the pipeline
by the average of these two values yielding:
4.05 x 10⁻⁵ (I/F units)/(DN/ms) for a solar-illuminated surface at 1 AU
2.01 x 10⁻⁹ (W/cm2/nm/sr)/(DN/ms) for a spectrally flat source radiance.
These constants really apply only at the center of the FOV; they may slightly overestimate the
scene reflectance or radiance at FOV locations away from the center.
The calibration constants derived above do not include the effects of viewing through the
periscope. NAVCAM views entirely or partially through the periscope for scan mirror angles
between 0degree and 16degree. The periscope reduces the light throughput to the NAVCAM, and it
produces double images when viewing partially through the periscope (>7degree mirror angle). The
optical throughput of the periscope was characterized using Stardust images of the Pleiades and
Spica and NExT images of the Moon. Figure 14 shows the relative throughput of the periscope
vs. scan mirror angle for these images; note that the throughput is slightly different as a function
of image line number for a given mirror angle. Images at lower line numbers have their
throughput profiles shifted toward higher mirror angles relative to those of images at higher line
numbers. The images of Star 1 were located at line numbers ranging between 423 and 526, those
for Star 2 ranged between 529 and 638, those for Star 3 ranged between 622 and 749, those for
Star 4 ranged between 614 and 715, those for Star 5 ranged between 657 and 790, and those for
star 6 ranged between 699 and 812. No throughput dependence on the image sample location
was observed over the range of sample numbers from 292 to 598. The Stardust Moon images
were located at line numbers ranging between 396 and 488; thus, the fact that the throughput
ratios for the Moon fall closest to those of Pleiades Star 1 is consistent with their similar line
locations.
The throughput vs. mirror angle plot suggests that as the mirror angle moves away from 0degree some
additional light starts to be lost when the angle reaches about 5degree. Perhaps the periscope no
longer fills the scan mirror entrance aperture at this angle. The amount of light lost continues to
increase up to a mirror angle of about 9degree. Beyond that angle some light that bypasses the
periscope starts to be captured by the scan mirror causing the "throughput" to increase. The
"throughput" continues to increase with mirror angle as more and more bypass light is captured,
until the periscope is no longer in the scan mirror FOV at all at an angle of about 16degree.
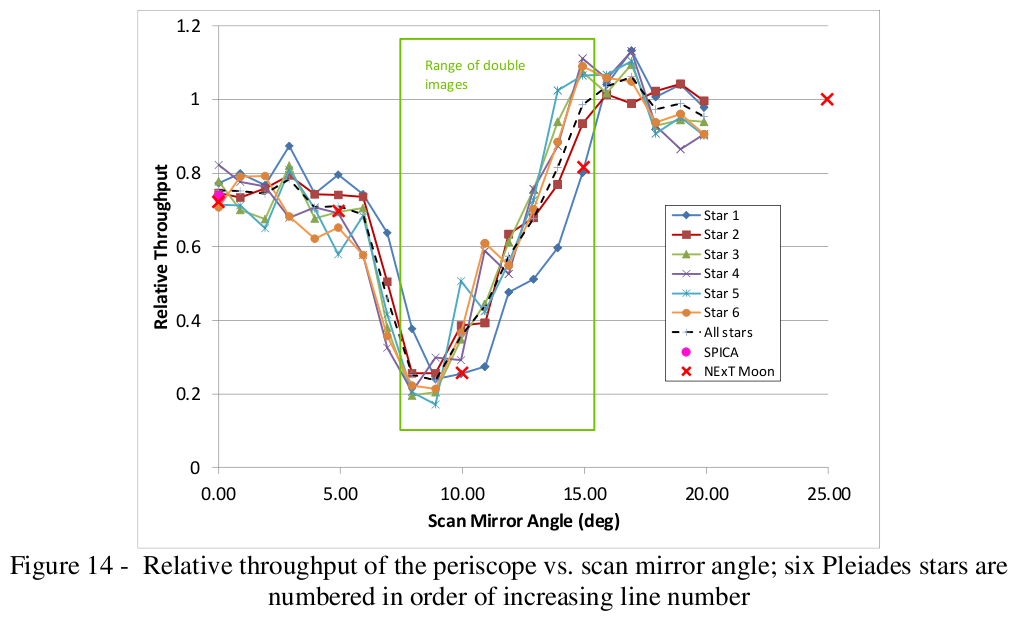 Figure 14 - Relative throughput of the periscope vs. scan mirror angle; six Pleiades stars are
numbered in order of increasing line number
The green box in Figure 14 shows the range of scan mirror angles over which double images can
occur due to the scan mirror intercepting some light passing through the periscope and some
light passing just outside the periscope and forming slightly offset images from each of these ray
bundles. Figure 15 (left) plots the fraction of the total star signal contained in each of the
doubled images when they occur, and Figure 15 (right) shows the pixel separation between the
doubled images. Again, both of these parameters depend on both the mirror angle and the line
location of the images. Figure 16 shows a NExT doubled image of the Moon at a scan mirror
angle of 15degree. No pipeline corrections for reduced periscope throughput or doubled images are
currently being implemented.
Figure 14 - Relative throughput of the periscope vs. scan mirror angle; six Pleiades stars are
numbered in order of increasing line number
The green box in Figure 14 shows the range of scan mirror angles over which double images can
occur due to the scan mirror intercepting some light passing through the periscope and some
light passing just outside the periscope and forming slightly offset images from each of these ray
bundles. Figure 15 (left) plots the fraction of the total star signal contained in each of the
doubled images when they occur, and Figure 15 (right) shows the pixel separation between the
doubled images. Again, both of these parameters depend on both the mirror angle and the line
location of the images. Figure 16 shows a NExT doubled image of the Moon at a scan mirror
angle of 15degree. No pipeline corrections for reduced periscope throughput or doubled images are
currently being implemented.
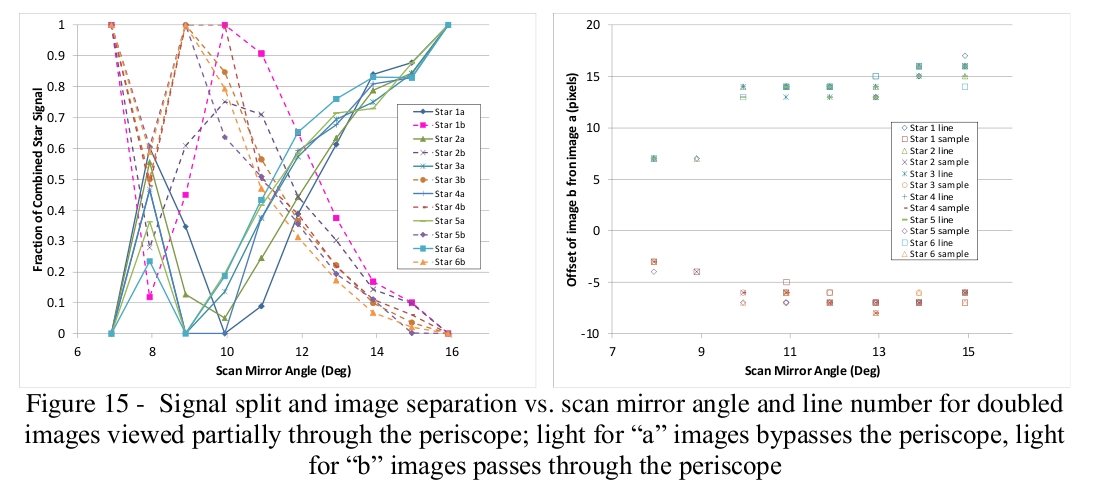 Figure 15 - Signal split and image separation vs. scan mirror angle and line number for doubled
images viewed partially through the periscope; light for "a" images bypasses the periscope, light
Scan Mirror Angle (Deg)
Figure 15 - Signal split and image separation vs. scan mirror angle and line number for doubled
images viewed partially through the periscope; light for "a" images bypasses the periscope, light
Scan Mirror Angle (Deg)
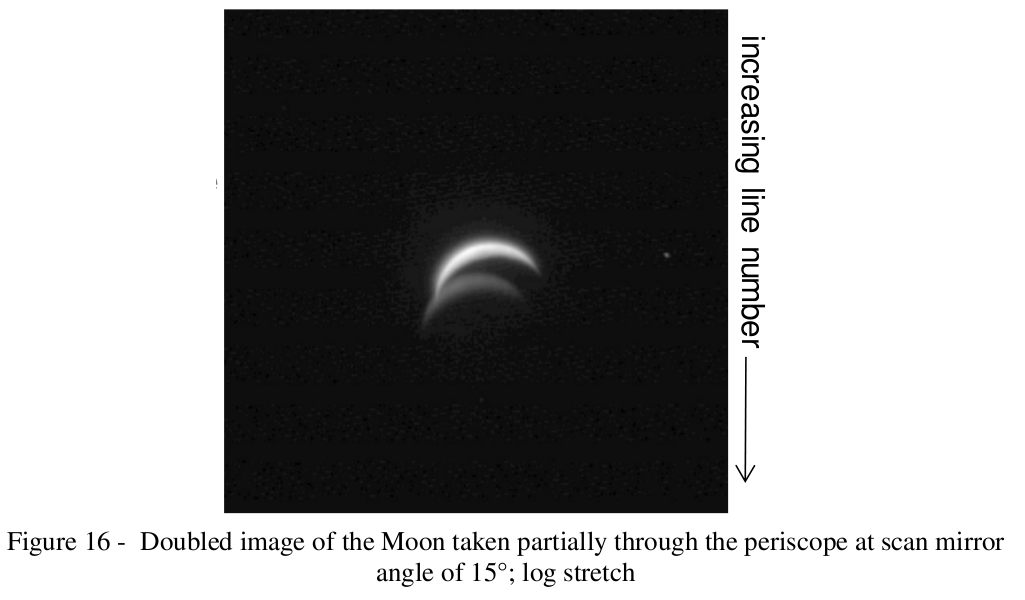 Figure 16 - Doubled image of the Moon taken partially through the periscope at scan mirror
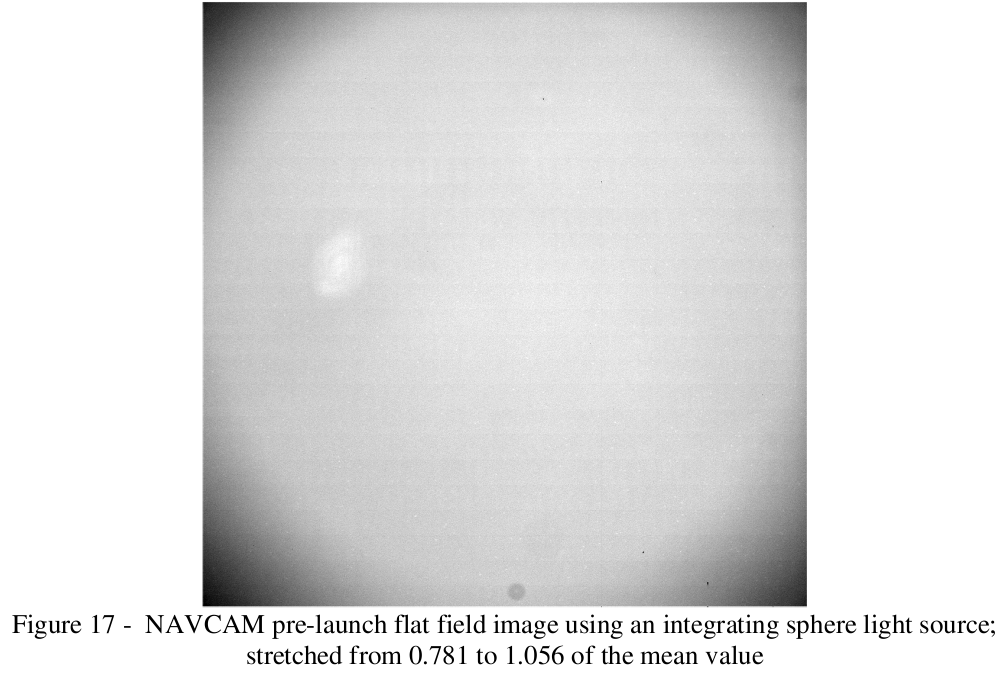 Figure 17 - NAVCAM pre-launch flat field image using an integrating sphere light source;
stretched from 0.781 to 1.056 of the mean value
Inflight flat-field calibration options are minimal. Possible approaches are: a) ratioed cal lamp
images (inflight/pre-launch times pre-launch flat), b) image stars at various locations in the FOV
(per Figure 13), or c) perhaps using diffuse scattered light input. Residual contamination
probably affects the inflight flat-field response, but exactly how is difficult to determine.
We used inflight cal lamp images to monitor the post-bake contamination state. Figure 18 shows
a comparison of cal lamp images taken before launch and in flight and the changes that occurred
during the NExT mission. As can be seen, the residual contamination after baking was rather
minimal and restricted to a few small clumps by December 2008. But after the August 2010
bake, the residual contamination pattern changed significantly, growing in size and number of
areas affected. The majority of the residual contamination is located near the center of the FOV.
By 14 days after the August 2010 bake, the contamination pattern had become more diffuse,
presumably due to the more volatile contamination starting to re-accumulate. The pattern after
the post-encounter bake is quite similar to that after the August 2010 bake. The residual
contamination pattern during 2011 tends to be somewhat consistent with the spatial distribution
of the measured/predicted signal ratios in the calibration star images (Figure 13) and might be its
cause (but it may not be the only, or even the primary, cause; spatial variations in response may
be due to some other effect that is less patchy, as suggested by the systematic variations seen in
Figure 13). We note, however, that whatever residual contamination there may be, NAVCAM
star images remained sharp in all inflight calibrations, and no degradation in spatial resolution is
indicated.
Figure 17 - NAVCAM pre-launch flat field image using an integrating sphere light source;
stretched from 0.781 to 1.056 of the mean value
Inflight flat-field calibration options are minimal. Possible approaches are: a) ratioed cal lamp
images (inflight/pre-launch times pre-launch flat), b) image stars at various locations in the FOV
(per Figure 13), or c) perhaps using diffuse scattered light input. Residual contamination
probably affects the inflight flat-field response, but exactly how is difficult to determine.
We used inflight cal lamp images to monitor the post-bake contamination state. Figure 18 shows
a comparison of cal lamp images taken before launch and in flight and the changes that occurred
during the NExT mission. As can be seen, the residual contamination after baking was rather
minimal and restricted to a few small clumps by December 2008. But after the August 2010
bake, the residual contamination pattern changed significantly, growing in size and number of
areas affected. The majority of the residual contamination is located near the center of the FOV.
By 14 days after the August 2010 bake, the contamination pattern had become more diffuse,
presumably due to the more volatile contamination starting to re-accumulate. The pattern after
the post-encounter bake is quite similar to that after the August 2010 bake. The residual
contamination pattern during 2011 tends to be somewhat consistent with the spatial distribution
of the measured/predicted signal ratios in the calibration star images (Figure 13) and might be its
cause (but it may not be the only, or even the primary, cause; spatial variations in response may
be due to some other effect that is less patchy, as suggested by the systematic variations seen in
Figure 13). We note, however, that whatever residual contamination there may be, NAVCAM
star images remained sharp in all inflight calibrations, and no degradation in spatial resolution is
indicated.
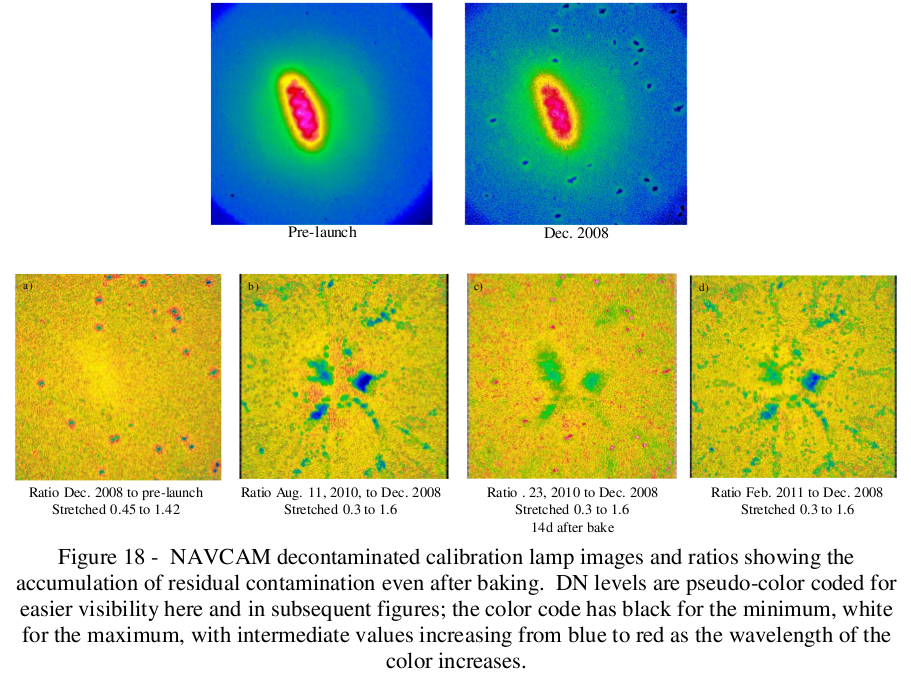 Figure 18 - NAVCAM decontaminated calibration lamp images and ratios showing the
accumulation of residual contamination even after baking. DN levels are pseudo-color coded for
easier visibility here and in subsequent figures; the color code has black for the minimum, white
for the maximum, with intermediate values increasing from blue to red as the wavelength of the
color increases.
We must be careful not to assume thatStretched contamination patterns seen in Figure 18 are directly
applicable as flat-field corrections for data taken of external targets. The lighting geometry on
the CCD from the calibration lamp is different than that from focused external targets. We can
see some examples of this in the illumination patterns of scattered light entering the camera from
external sources. Figure 19 shows examples of such images taken during the Tempel 1 approach
and departure sequences (no long-exposure full frames were taken during these periods, only
windowed frames). While the contrast pattern seen in the calibration lamp images of Figure 18
is recognizable, it is not identical, and the pattern moves around within the FOV somewhat (see
especially frame n10190te01, a 16CygA+B image taken during the Jan. 27 calibration activity).
These variations make a true flat-field correction based on calibration lamp and/or scattered light
images very challenging.
Figure 18 - NAVCAM decontaminated calibration lamp images and ratios showing the
accumulation of residual contamination even after baking. DN levels are pseudo-color coded for
easier visibility here and in subsequent figures; the color code has black for the minimum, white
for the maximum, with intermediate values increasing from blue to red as the wavelength of the
color increases.
We must be careful not to assume thatStretched contamination patterns seen in Figure 18 are directly
applicable as flat-field corrections for data taken of external targets. The lighting geometry on
the CCD from the calibration lamp is different than that from focused external targets. We can
see some examples of this in the illumination patterns of scattered light entering the camera from
external sources. Figure 19 shows examples of such images taken during the Tempel 1 approach
and departure sequences (no long-exposure full frames were taken during these periods, only
windowed frames). While the contrast pattern seen in the calibration lamp images of Figure 18
is recognizable, it is not identical, and the pattern moves around within the FOV somewhat (see
especially frame n10190te01, a 16CygA+B image taken during the Jan. 27 calibration activity).
These variations make a true flat-field correction based on calibration lamp and/or scattered light
images very challenging.
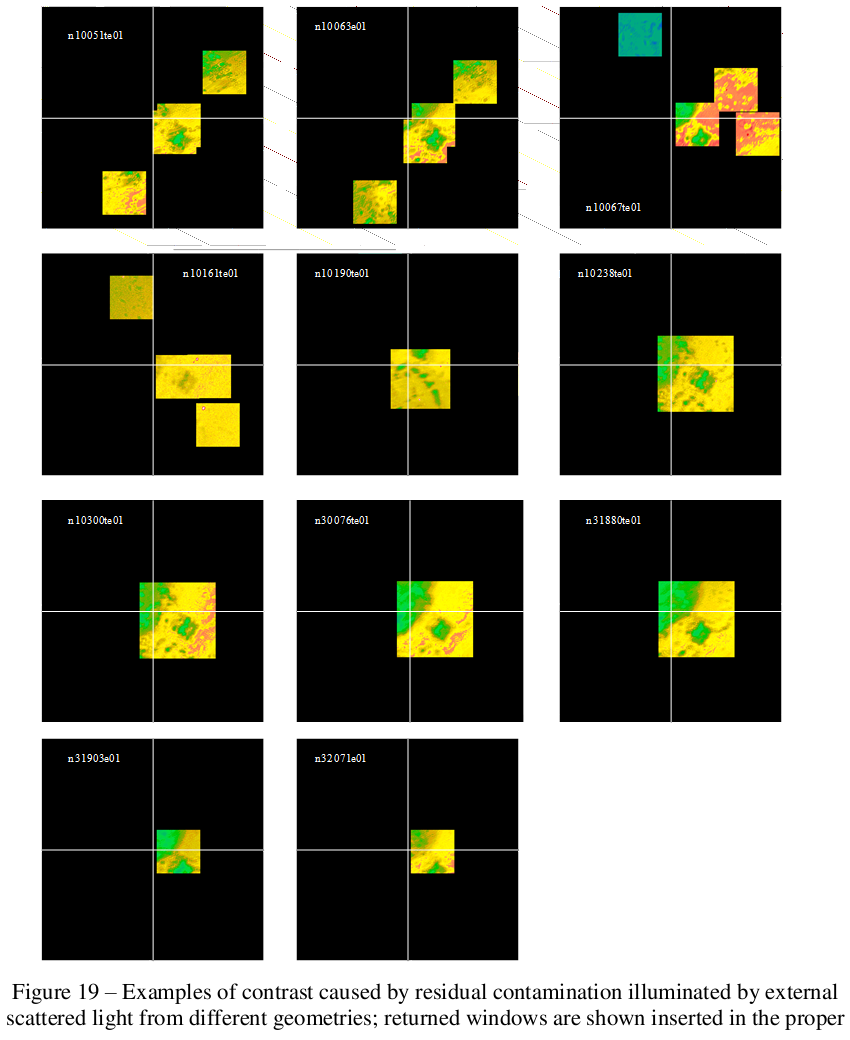 Figure 19 - Examples of contrast caused by residual contamination illuminated by external
scattered light from different geometries; returned windows are shown inserted in the proper
locations within the FOV
Given the difficulties and instabilities in determining the NAVCAM flat-field response in flight,
we have elected to correct only using the pre-launch flat-field calibration file. Cal lamp and
scattered light illumination geometries are not the same as for a focused external source.
Attempting to correct for the changing residual contamination is too uncertain and could do more
harm than good. The star-based paraboloid adjustment discussed above might help, but this
would need to be justified by additional science testing before incorporating such a correction
into the pipeline. (Note: researchers who may wish to try applying the paraboloid model fit
derived in this work to see if it makes their analysis more believable may use this equation for
the best-fit paraboloid:
z = 7.48e-7(x-512)2-2.144e-3(x-512)+8.70e-7(y-512)2-2.059e-5(y-512)+0.962,
where x = sample number and y = line number.) As yet, no evidence of non-uniform response
across the FOV of encounter images has been observed or reported.
Scattered light
No light scattering internal to the NAVCAM was detected at more than 0.5 DN/s in 2-s
exposures of Canopus (110 saturated pixels; see Figure 22). However, NAVCAM has proved
highly susceptible to scattered Sunlight reflected off various spacecraft structures. Significant
scattered light has been detected even for Sun-illumination directions at which the NAVCAM
was thought to be well shadowed. No comprehensive calibration of scattered light rates vs. Sun
direction and mirror angle has been possible; such a calibration would require a huge effort with
>106 frames returned to Earth. However, a sense of the dependence of scattered light levels on
the illumination and mirror angle geometries has been provided by accumulated inflight
experience.
Figure 20 shows a model of the Stardust spacecraft including its coordinate system and the
NAVCAM and periscope mounting locations. The spacecraft is normally positioned at an
attitude with the Sun in the +Z hemisphere, most typically in the XZ plane and close to the +Z
axis direction. The figure includes a sketch showing the azimuth and elevation convention used
here to define the Sun-illumination direction. Figure 20 also shows the scattered light rates
measured for frames taken at various Sun-illumination directions and scan mirror angles during
both the prime Stardust and NExT missions. In general, we see that scattered light is greatest for
mirror angles <30degree or >160degree or for Sun elevation angles <40degree. However, rates in excess of 10
DN/s are also seen for mirror angles >90degree and Sun elevation angles as high as 78degree when the Sun
is in the -X hemisphere.
We included a special scattered light calibration in the December 2008 cruise calibration in
which we placed the spacecraft in the same attitude with respect to the Sun direction that it
would be for the Tempel 1 encounter and observed with mirror angles of 2degree, 7degree, 12degree, 17degree, 22degree,
171degree, and 176degree. These observations are shown as blue filled diamonds in the lower-right plot of
Figure 20. The attitude chosen was for the spacecraft flying with its Whipple shields forward, as
expected for encounter. These measurements showed that scattered light would be acceptably
small for the encounter. However, we later decided to start the Tempel 1 approach observations
with the spacecraft flying backward, i.e., with its Whipple shields in the opposite direction from
the velocity vector. This attitude was adopted because it simplified operations, minimized
spacecraft attitude maneuvering, and minimized propellant usage. We neglected to appreciate
that we had never done a scattered light calibration in that attitude. Unfortunately, in this attitude
as the mirror angles increased to 168degree and beyond, the scattered light rates increased
dramatically (red crosses in lower-right plot of Figure 20). In addition, on departure from
Tempel 1 flying forward, the Sun-illumination direction was different enough from our
calibration attitude that scattered light again proved much higher than expected for mirror angles
above 168degree. The scattered light caused substantial degradation in the quality of the approach and
departure imagery, which were taken with exposure times of 5, 10 or 20 s. And our experience
demonstrated that even small differences in spacecraft attitude and/or mirror angle could cause
large changes in the scattered light level.
Figure 19 - Examples of contrast caused by residual contamination illuminated by external
scattered light from different geometries; returned windows are shown inserted in the proper
locations within the FOV
Given the difficulties and instabilities in determining the NAVCAM flat-field response in flight,
we have elected to correct only using the pre-launch flat-field calibration file. Cal lamp and
scattered light illumination geometries are not the same as for a focused external source.
Attempting to correct for the changing residual contamination is too uncertain and could do more
harm than good. The star-based paraboloid adjustment discussed above might help, but this
would need to be justified by additional science testing before incorporating such a correction
into the pipeline. (Note: researchers who may wish to try applying the paraboloid model fit
derived in this work to see if it makes their analysis more believable may use this equation for
the best-fit paraboloid:
z = 7.48e-7(x-512)2-2.144e-3(x-512)+8.70e-7(y-512)2-2.059e-5(y-512)+0.962,
where x = sample number and y = line number.) As yet, no evidence of non-uniform response
across the FOV of encounter images has been observed or reported.
Scattered light
No light scattering internal to the NAVCAM was detected at more than 0.5 DN/s in 2-s
exposures of Canopus (110 saturated pixels; see Figure 22). However, NAVCAM has proved
highly susceptible to scattered Sunlight reflected off various spacecraft structures. Significant
scattered light has been detected even for Sun-illumination directions at which the NAVCAM
was thought to be well shadowed. No comprehensive calibration of scattered light rates vs. Sun
direction and mirror angle has been possible; such a calibration would require a huge effort with
>106 frames returned to Earth. However, a sense of the dependence of scattered light levels on
the illumination and mirror angle geometries has been provided by accumulated inflight
experience.
Figure 20 shows a model of the Stardust spacecraft including its coordinate system and the
NAVCAM and periscope mounting locations. The spacecraft is normally positioned at an
attitude with the Sun in the +Z hemisphere, most typically in the XZ plane and close to the +Z
axis direction. The figure includes a sketch showing the azimuth and elevation convention used
here to define the Sun-illumination direction. Figure 20 also shows the scattered light rates
measured for frames taken at various Sun-illumination directions and scan mirror angles during
both the prime Stardust and NExT missions. In general, we see that scattered light is greatest for
mirror angles <30degree or >160degree or for Sun elevation angles <40degree. However, rates in excess of 10
DN/s are also seen for mirror angles >90degree and Sun elevation angles as high as 78degree when the Sun
is in the -X hemisphere.
We included a special scattered light calibration in the December 2008 cruise calibration in
which we placed the spacecraft in the same attitude with respect to the Sun direction that it
would be for the Tempel 1 encounter and observed with mirror angles of 2degree, 7degree, 12degree, 17degree, 22degree,
171degree, and 176degree. These observations are shown as blue filled diamonds in the lower-right plot of
Figure 20. The attitude chosen was for the spacecraft flying with its Whipple shields forward, as
expected for encounter. These measurements showed that scattered light would be acceptably
small for the encounter. However, we later decided to start the Tempel 1 approach observations
with the spacecraft flying backward, i.e., with its Whipple shields in the opposite direction from
the velocity vector. This attitude was adopted because it simplified operations, minimized
spacecraft attitude maneuvering, and minimized propellant usage. We neglected to appreciate
that we had never done a scattered light calibration in that attitude. Unfortunately, in this attitude
as the mirror angles increased to 168degree and beyond, the scattered light rates increased
dramatically (red crosses in lower-right plot of Figure 20). In addition, on departure from
Tempel 1 flying forward, the Sun-illumination direction was different enough from our
calibration attitude that scattered light again proved much higher than expected for mirror angles
above 168degree. The scattered light caused substantial degradation in the quality of the approach and
departure imagery, which were taken with exposure times of 5, 10 or 20 s. And our experience
demonstrated that even small differences in spacecraft attitude and/or mirror angle could cause
large changes in the scattered light level.
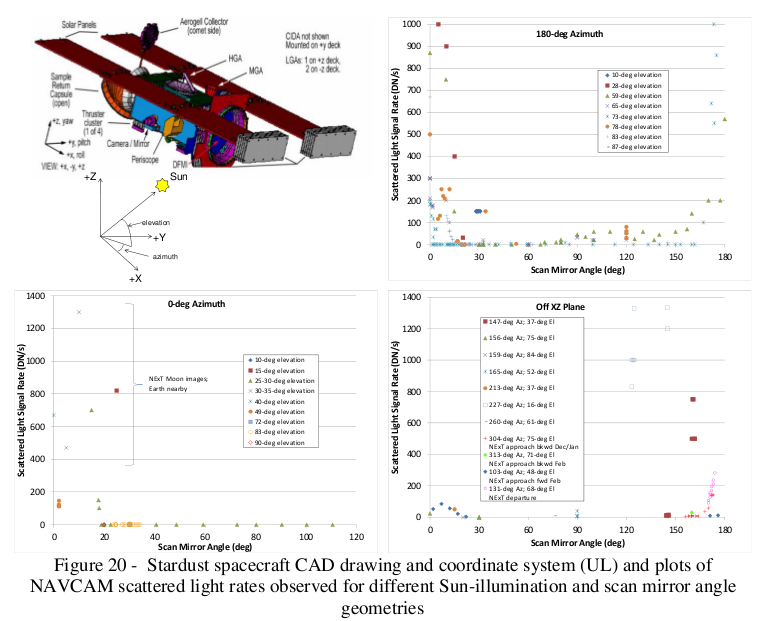 Figure 20 - Stardust spacecraft CAD drawing and coordinate system (UL) and plots of
NAVCAM scattered light rates observed for different Sun-illumination and scan mirror angle
geometries
A few special cases of elevated scattered light in peculiar ghost image patterns have been
observed in frames taken through the periscope. Figure 21 shows the three cases noted to date.
The scattered light signal rates are extremely high, >10000 DN/s in the left and center Moon
images and ~800 DN/s in the right image, which did not view any specific target. These ghost
image patterns are apparently due to internal NAVCAM or periscope reflections. Spots are seen
in the ghosts that look like the residual contamination spots in cal lamp images, and there are
structures suggestive of secondary mirror spider supports. The ghost signal rates are at about 5%
of the maximum Moon signal rate in the Moon frames; however, the lit Earth was within 15degree of
the Moon, so the ghost could be an Earth illumination effect.
Figure 20 - Stardust spacecraft CAD drawing and coordinate system (UL) and plots of
NAVCAM scattered light rates observed for different Sun-illumination and scan mirror angle
geometries
A few special cases of elevated scattered light in peculiar ghost image patterns have been
observed in frames taken through the periscope. Figure 21 shows the three cases noted to date.
The scattered light signal rates are extremely high, >10000 DN/s in the left and center Moon
images and ~800 DN/s in the right image, which did not view any specific target. These ghost
image patterns are apparently due to internal NAVCAM or periscope reflections. Spots are seen
in the ghosts that look like the residual contamination spots in cal lamp images, and there are
structures suggestive of secondary mirror spider supports. The ghost signal rates are at about 5%
of the maximum Moon signal rate in the Moon frames; however, the lit Earth was within 15degree of
the Moon, so the ghost could be an Earth illumination effect.
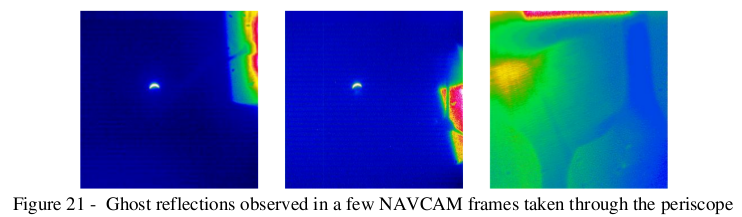 Figure 21 - Ghost reflections observed in a few NAVCAM frames taken through the periscope
Finally, elevated ratelevels were observed in dark frames taken while pointed at the Moon.
We attribute this to a light leak in the NAVCAM system that allows light at about the 10 level
to reach- Might be Earth the shutter is closed.
As is the case for many CCD detectors, charge generated in excess of a pixel's full-well capacity
will bleed up and down the CCD column. We characterized this effect using saturated images of
Canopus (see Figure 22). From analysis of such images, we find that the pixel well capacity is
about 250,000 e- (equivalent to ~10000 DN). No bleeding is seen in star, cal lamp, or Moon
frames with charge levels up to ~200,000 e-/pixel. In these saturated Canopus frames, we also
observe deferred charge in the first column to the right of a saturated column at a level of ~150
DN. Apparently, the serial register has a lower full-well limit than the active array pixels or
contains a small charge trap. The former explanation seems more plausible since we see no
deferred charge in any unsaturated star images. In addition, the pixels immediately above and
below the saturated portions of a bled column may contain the last of the excess charge, which
would elevate their signal levels but not above the 4095 DN encoding limit.
Figure 21 - Ghost reflections observed in a few NAVCAM frames taken through the periscope
Finally, elevated ratelevels were observed in dark frames taken while pointed at the Moon.
We attribute this to a light leak in the NAVCAM system that allows light at about the 10 level
to reach- Might be Earth the shutter is closed.
As is the case for many CCD detectors, charge generated in excess of a pixel's full-well capacity
will bleed up and down the CCD column. We characterized this effect using saturated images of
Canopus (see Figure 22). From analysis of such images, we find that the pixel well capacity is
about 250,000 e- (equivalent to ~10000 DN). No bleeding is seen in star, cal lamp, or Moon
frames with charge levels up to ~200,000 e-/pixel. In these saturated Canopus frames, we also
observe deferred charge in the first column to the right of a saturated column at a level of ~150
DN. Apparently, the serial register has a lower full-well limit than the active array pixels or
contains a small charge trap. The former explanation seems more plausible since we see no
deferred charge in any unsaturated star images. In addition, the pixels immediately above and
below the saturated portions of a bled column may contain the last of the excess charge, which
would elevate their signal levels but not above the 4095 DN encoding limit.
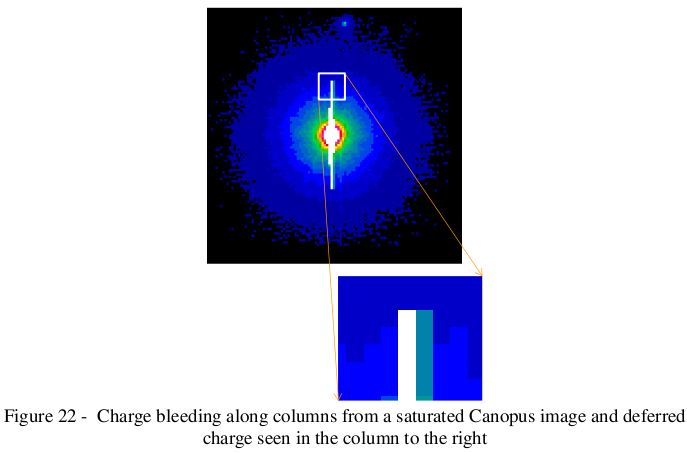 Figure 22 - Charge bleeding along columns from a saturated Canopus image and deferred
charge seen in the column to the right
Tests for any sign of residual image charge were conducted using saturated star and Moon
frames followed immediately by a dark frame. No evidence of any residual image was seen. A
check for evidence of transient quantum efficiency effects from pixel saturation (sometimes
called "residual bulk image") was also done using successive partially overlapping Moon
images, the first of which was saturated and second of which was not. No sign of distorted
isophotes was observed in the second frame indicating that the quantum efficiency was not
affected by prior saturation of the pixels.
6. Calibration Pipeline Logic Flow and Data Archiving
To produce calibrated archival data records for NAVCAM, the NExT science team relies on a
processing system evolved from that used on the Deep Impact and EPOXI missions and located
at Cornell University (Klaasen, et al., 2008). This processing pipeline systematically carries out
the normal calibration steps using the best available calibration files and constants. As part of
the calibration process, auxiliary data extensions recording the quality of the calibrated value, an
estimate of the uncertainty, and the SNR for each pixel are generated in image format and
appended to each calibrated image record. The calibration pipeline logic flow is illustrated in
Figure 23.
Figure 22 - Charge bleeding along columns from a saturated Canopus image and deferred
charge seen in the column to the right
Tests for any sign of residual image charge were conducted using saturated star and Moon
frames followed immediately by a dark frame. No evidence of any residual image was seen. A
check for evidence of transient quantum efficiency effects from pixel saturation (sometimes
called "residual bulk image") was also done using successive partially overlapping Moon
images, the first of which was saturated and second of which was not. No sign of distorted
isophotes was observed in the second frame indicating that the quantum efficiency was not
affected by prior saturation of the pixels.
6. Calibration Pipeline Logic Flow and Data Archiving
To produce calibrated archival data records for NAVCAM, the NExT science team relies on a
processing system evolved from that used on the Deep Impact and EPOXI missions and located
at Cornell University (Klaasen, et al., 2008). This processing pipeline systematically carries out
the normal calibration steps using the best available calibration files and constants. As part of
the calibration process, auxiliary data extensions recording the quality of the calibrated value, an
estimate of the uncertainty, and the SNR for each pixel are generated in image format and
appended to each calibrated image record. The calibration pipeline logic flow is illustrated in
Figure 23.
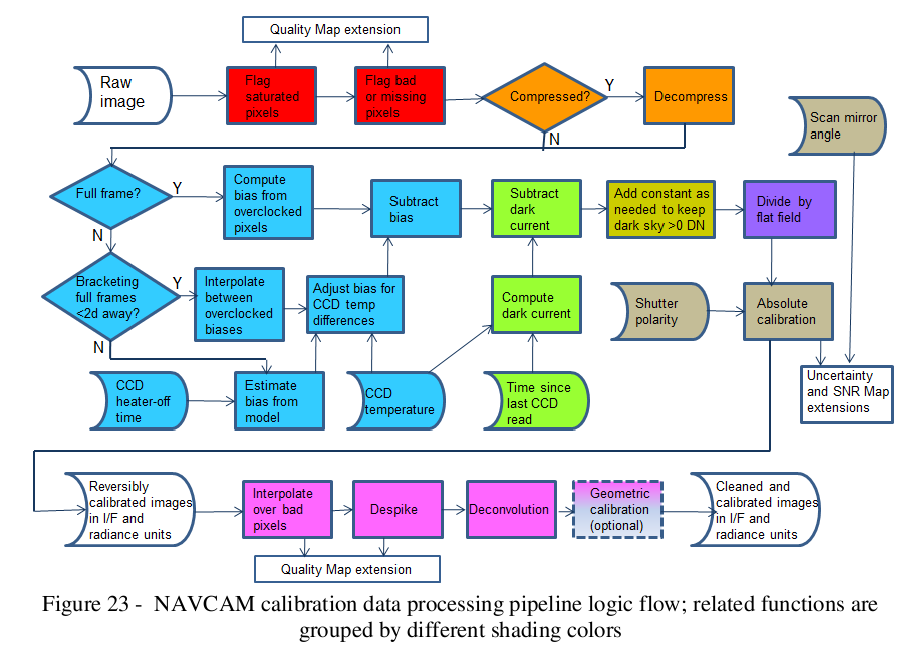 Figure 23 - NAVCAM calibration data processing pipeline logic flow; related functions are
grouped by different shading colors
All saturated, bad, or missing pixels are flagged in the quality map extension. Compressed
frames are decompressed by reversing the lookup table used to compress the data onboard. The
best-estimate bias level and dark current are then subtracted from the image. For images that
contain substantial amounts of dark sky, an adjustment is done if necessary to ensure that the
bias and dark subtractions have not removed too much signal making dark sky levels go
negative. Next the image is divided by the flat field calibration file to correct for variable
responsivity across the detector. The data are then converted to absolute radiance and
reflectivity units using the radiometric calibration conversion factors and the shutter time
(adjusted for shutter offset) and are saved for archiving. The uncertainty and SNR map
extensions are generated and stored after this step. Next a series of irreversible adjustments are
made to clean up artifacts and improve spatial resolution in the images. Data values in known
bad pixel locations are interpolated over from neighboring pixel values. Noise spikes exceeding
a specified threshold are also removed via near-neighbor interpolation. These adjustments are
recorded in the quality map extension. Spatial resolution is then improved using a deconvolution
process with a filter based on the NAVCAM psf. These cleaned up calibrated versions are also
saved for archiving. Any geometric calibration is left as a separate option for users to perform if
they choose.
The calibration quality map is a byte image map defining the integrity of every pixel. Each bit in
the byte for each pixel is set to 1 if a given criterion is met. These flags are:
Bit Criterion for setting to 1
0 Pixel is outside the commanded returned window(s)
1 Known bad pixel (none have been identified to date)
2 Missing data; data not received from the spacecraft
3 Saturated value
4 Value potentially corrupted by neighboring saturated pixel
5 Interpolated; pixel value reclaimed by interpolating from neighbors
6 Despiked; pixel value modified by the despiking routine
7 Spare
For example, if a pixel is bad and has been reclaimed by interpolation, the decimal value in the
quality map will be 21+25=34. In the normal FITS format for the calibrated image, this map
exists as the first image extension.
The uncertainty map is the next image extension. It provides a percentage uncertainty in the
calibrated pixel value (exclusive of random noise). This uncertainty includes the errors due to
incorrect estimations of bias level, dark current level, and exposure time and the effects of
viewing through the periscope.
The SNR map is as defined for Deep Impact in Klaasen, et al., (2008) with the appropriate
NAVCAM values for read noise and gain substituted. This map exists as the last image map
extension.
The raw and calibrated data, along with calibration files and other ancillary information, will be
archived with the Planetary Data System Small Bodies Node by the fall of 2011 (Veverka, et al.,
2011b; Veverka, et al., 2011c).
Conclusion
Significant improvements in the calibration of the Stardust-NExT NAVCAM have been realized
through the acquisition of new calibration data during the NExT mission as well as reanalysis of
prime mission data. The camera psf was characterized down to an unprecedented level of nearly
10-6 of the total point-source star signal. Star images were used to monitor the effectiveness of
CCD heating in removing recurring contamination from the detector. Shutter performance was
calibrated as a function of image line number and shutter blade movement direction to an
accuracy of <0.1 ms. Models for estimating the bias and dark current levels as functions of CCD
temperature and time since the CCD heater was last powered off were developed that allow
reasonably accurate radiometric calibration of windowed images, which do not return the
overclocked pixel values that explicitly provide the bias level. Absolute radiometric response
calibration conversion constants were derived from images of photometric standard stars.
Residual contamination patterns were tracked to assess their impact on flat-field calibrations.
The dependence of scattered light levels on Sun-illumination and scan mirror position was
determined for many geometries. The data processing pipeline has been updated to incorporate
these improved calibrations and will be used to generate archival NAVCAM data records for
both the NExT (new) and the primary Stardust mission (upgrade), which will be delivered to the
Planetary Data System.
Acknowledgements
The work described herein was supported by the National Aeronautics and Space Administration
through Contract No. NNM08AA26C from the Discovery Program to Cornell University and
through Task Order No. NMO711001 from the Discovery Program to the Jet Propulsion
Laboratory, California Institute of Technology.
References
Brownlee, D. E., et al., "The Surface of young Jupiter family comet Wild 2: View from the
Stardust spacecraft," Science, v. 304, no. 5678, pp. 1764-1769, June 18, 2004.
Burnashev, V. I., "Stellar spectrophotometric catalogue," Abastumanskaya Astrofiz. Obs. Bull.
59, 83, 1985.
Duxbury, T. C., et al., "The Asteroid 5535 Annefrank size, shape, and orientation: Stardust first
results," JGR-Planets, v. 109, issue E2, article E02002, Feb. 6, 2004.
Hillier, J. K., J. M. Bauer, and B. J. Buratti, "Photometric modeling of Asteroid 5535 Annefrank
from Stardust observations," Icarus, v. 211, pp. 546-552, 2011.
Hog, E., et al., "Construction and verification of the Tycho-2 catalogue," Astron. Astrophys.,
357, 367, 2000.
Janesick, J., K. Klaasen, and T. Elliott, "Charge-coupled device charge-collection efficiency and
the photon-transfer technique, Opt. Eng., 26, 10, 972, 1987.
Klaasen, K.. P., et al., "Deep Impact instrument calibration," Review of Scientific Instruments,
79, 091301, 2008.
Li, J-Y, M. F. A'Hearn, T. L. Farnham, and L. A. McFadden, "Photometric analysis of the
nucleus of Comet 81P/Wild 2 from Stardust images," Icarus, v. 204, pp. 209-226, 2009.
Morel, M. and P. Magnenat, "UBVRIJKLMNH photoelectric photometric catalog," Astron.
Astropys. Suppl., 34, 477, 1978.
Newburn, R. L., "Calibration of the STARDUST navigation camera,"
http://pdssbn.astro.umd.edu/holdings/sdu-c-navcam-3-rdr-wild2-
v2.0/document/calrpt/calibrpt.pdf, 2000.
Newburn, R. L., S. Bhaskaran, T. Duxbury, G. Fraschetti, T. Radey, and M. Schwochert,
"Stardust imaging camera," JGR, v. 108, no. E10, pg. 8116, 2003a.
Newburn, R. L., et al., "Phase curve and albedo of asteroid 5535 Annefrank," JGR, v. 108, no.
E11, pg. 5117, 2003b.
Pickles, A. J., "A stellar spectral flux library: 1150-25000 Angstrom," Publications of the Astronomical
Society of the Pacific, 110:863-878, 1998.
Tsou, P., et al., "Stardust encounters comet 81P/Wild 2," JGR, v. 109, E12S01, 2004.
Veverka, J., et al., "Return to Comet Tempel 1 : Overview of Results from Stardust-NExT,"
Icarus, this issue, 2011a.
Veverka, J. F., K.P. Klaasen, B.V. Semenov, S.A. McLauglin, B.T. Carcich, and S.E. Sackett,
"Stardust-NExT NAVCAM images of 9P/Tempel 1," SDU-C/CAL-NAVCAM-2-NEXT-
TEMPEL1-V1.0, NASA Planetary Data System, 2011b.
Veverka, J. F., K.P. Klaasen, B.V. Semenov, S.A. McLauglin, B.T. Carcich, and S.E. Sackett,
"Stardust-NExT NAVCAM calibrated images of 9P/TEMPEL 1," SDU-C/CAL-
NAVCAM-3-NEXT-TEMPEL1-V1.0, NASA Planetary Data System, 2011c.
Figure 23 - NAVCAM calibration data processing pipeline logic flow; related functions are
grouped by different shading colors
All saturated, bad, or missing pixels are flagged in the quality map extension. Compressed
frames are decompressed by reversing the lookup table used to compress the data onboard. The
best-estimate bias level and dark current are then subtracted from the image. For images that
contain substantial amounts of dark sky, an adjustment is done if necessary to ensure that the
bias and dark subtractions have not removed too much signal making dark sky levels go
negative. Next the image is divided by the flat field calibration file to correct for variable
responsivity across the detector. The data are then converted to absolute radiance and
reflectivity units using the radiometric calibration conversion factors and the shutter time
(adjusted for shutter offset) and are saved for archiving. The uncertainty and SNR map
extensions are generated and stored after this step. Next a series of irreversible adjustments are
made to clean up artifacts and improve spatial resolution in the images. Data values in known
bad pixel locations are interpolated over from neighboring pixel values. Noise spikes exceeding
a specified threshold are also removed via near-neighbor interpolation. These adjustments are
recorded in the quality map extension. Spatial resolution is then improved using a deconvolution
process with a filter based on the NAVCAM psf. These cleaned up calibrated versions are also
saved for archiving. Any geometric calibration is left as a separate option for users to perform if
they choose.
The calibration quality map is a byte image map defining the integrity of every pixel. Each bit in
the byte for each pixel is set to 1 if a given criterion is met. These flags are:
Bit Criterion for setting to 1
0 Pixel is outside the commanded returned window(s)
1 Known bad pixel (none have been identified to date)
2 Missing data; data not received from the spacecraft
3 Saturated value
4 Value potentially corrupted by neighboring saturated pixel
5 Interpolated; pixel value reclaimed by interpolating from neighbors
6 Despiked; pixel value modified by the despiking routine
7 Spare
For example, if a pixel is bad and has been reclaimed by interpolation, the decimal value in the
quality map will be 21+25=34. In the normal FITS format for the calibrated image, this map
exists as the first image extension.
The uncertainty map is the next image extension. It provides a percentage uncertainty in the
calibrated pixel value (exclusive of random noise). This uncertainty includes the errors due to
incorrect estimations of bias level, dark current level, and exposure time and the effects of
viewing through the periscope.
The SNR map is as defined for Deep Impact in Klaasen, et al., (2008) with the appropriate
NAVCAM values for read noise and gain substituted. This map exists as the last image map
extension.
The raw and calibrated data, along with calibration files and other ancillary information, will be
archived with the Planetary Data System Small Bodies Node by the fall of 2011 (Veverka, et al.,
2011b; Veverka, et al., 2011c).
Conclusion
Significant improvements in the calibration of the Stardust-NExT NAVCAM have been realized
through the acquisition of new calibration data during the NExT mission as well as reanalysis of
prime mission data. The camera psf was characterized down to an unprecedented level of nearly
10-6 of the total point-source star signal. Star images were used to monitor the effectiveness of
CCD heating in removing recurring contamination from the detector. Shutter performance was
calibrated as a function of image line number and shutter blade movement direction to an
accuracy of <0.1 ms. Models for estimating the bias and dark current levels as functions of CCD
temperature and time since the CCD heater was last powered off were developed that allow
reasonably accurate radiometric calibration of windowed images, which do not return the
overclocked pixel values that explicitly provide the bias level. Absolute radiometric response
calibration conversion constants were derived from images of photometric standard stars.
Residual contamination patterns were tracked to assess their impact on flat-field calibrations.
The dependence of scattered light levels on Sun-illumination and scan mirror position was
determined for many geometries. The data processing pipeline has been updated to incorporate
these improved calibrations and will be used to generate archival NAVCAM data records for
both the NExT (new) and the primary Stardust mission (upgrade), which will be delivered to the
Planetary Data System.
Acknowledgements
The work described herein was supported by the National Aeronautics and Space Administration
through Contract No. NNM08AA26C from the Discovery Program to Cornell University and
through Task Order No. NMO711001 from the Discovery Program to the Jet Propulsion
Laboratory, California Institute of Technology.
References
Brownlee, D. E., et al., "The Surface of young Jupiter family comet Wild 2: View from the
Stardust spacecraft," Science, v. 304, no. 5678, pp. 1764-1769, June 18, 2004.
Burnashev, V. I., "Stellar spectrophotometric catalogue," Abastumanskaya Astrofiz. Obs. Bull.
59, 83, 1985.
Duxbury, T. C., et al., "The Asteroid 5535 Annefrank size, shape, and orientation: Stardust first
results," JGR-Planets, v. 109, issue E2, article E02002, Feb. 6, 2004.
Hillier, J. K., J. M. Bauer, and B. J. Buratti, "Photometric modeling of Asteroid 5535 Annefrank
from Stardust observations," Icarus, v. 211, pp. 546-552, 2011.
Hog, E., et al., "Construction and verification of the Tycho-2 catalogue," Astron. Astrophys.,
357, 367, 2000.
Janesick, J., K. Klaasen, and T. Elliott, "Charge-coupled device charge-collection efficiency and
the photon-transfer technique, Opt. Eng., 26, 10, 972, 1987.
Klaasen, K.. P., et al., "Deep Impact instrument calibration," Review of Scientific Instruments,
79, 091301, 2008.
Li, J-Y, M. F. A'Hearn, T. L. Farnham, and L. A. McFadden, "Photometric analysis of the
nucleus of Comet 81P/Wild 2 from Stardust images," Icarus, v. 204, pp. 209-226, 2009.
Morel, M. and P. Magnenat, "UBVRIJKLMNH photoelectric photometric catalog," Astron.
Astropys. Suppl., 34, 477, 1978.
Newburn, R. L., "Calibration of the STARDUST navigation camera,"
http://pdssbn.astro.umd.edu/holdings/sdu-c-navcam-3-rdr-wild2-
v2.0/document/calrpt/calibrpt.pdf, 2000.
Newburn, R. L., S. Bhaskaran, T. Duxbury, G. Fraschetti, T. Radey, and M. Schwochert,
"Stardust imaging camera," JGR, v. 108, no. E10, pg. 8116, 2003a.
Newburn, R. L., et al., "Phase curve and albedo of asteroid 5535 Annefrank," JGR, v. 108, no.
E11, pg. 5117, 2003b.
Pickles, A. J., "A stellar spectral flux library: 1150-25000 Angstrom," Publications of the Astronomical
Society of the Pacific, 110:863-878, 1998.
Tsou, P., et al., "Stardust encounters comet 81P/Wild 2," JGR, v. 109, E12S01, 2004.
Veverka, J., et al., "Return to Comet Tempel 1 : Overview of Results from Stardust-NExT,"
Icarus, this issue, 2011a.
Veverka, J. F., K.P. Klaasen, B.V. Semenov, S.A. McLauglin, B.T. Carcich, and S.E. Sackett,
"Stardust-NExT NAVCAM images of 9P/Tempel 1," SDU-C/CAL-NAVCAM-2-NEXT-
TEMPEL1-V1.0, NASA Planetary Data System, 2011b.
Veverka, J. F., K.P. Klaasen, B.V. Semenov, S.A. McLauglin, B.T. Carcich, and S.E. Sackett,
"Stardust-NExT NAVCAM calibrated images of 9P/TEMPEL 1," SDU-C/CAL-
NAVCAM-3-NEXT-TEMPEL1-V1.0, NASA Planetary Data System, 2011c.